
GRE Prep Club Daily Prep
Thank you for using the timer - this advanced tool can estimate your performance and suggest more practice questions. We have subscribed you to Daily Prep Questions via email.
Customized
for You
Track
Your Progress
Practice
Pays
Not interested in getting valuable practice questions and articles delivered to your email? No problem, unsubscribe here.
Fifteen college seniors, none of whom took any math classes
[#permalink]
 11 Oct 2017, 22:12
3

00:00
Question Stats:
 76% (02:10) correct
23% (04:08) wrong based on 13 sessions
76% (02:10) correct
23% (04:08) wrong based on 13 sessions
Hide Show timer Statistics
Fifteen college seniors, none of whom took any math classes in college, were selected for a clinical trial. An online GRE Math Course was made available to them, and these students were allowed to study for however many hours they wanted. Then, each took the GRE for their first time. The graph below records how many hours each student studied, using the online material, and that student’s GRE Quant score. The best-fit line model shows the best prediction, given such a student’s hours of study, of what her GRE Q score might be.
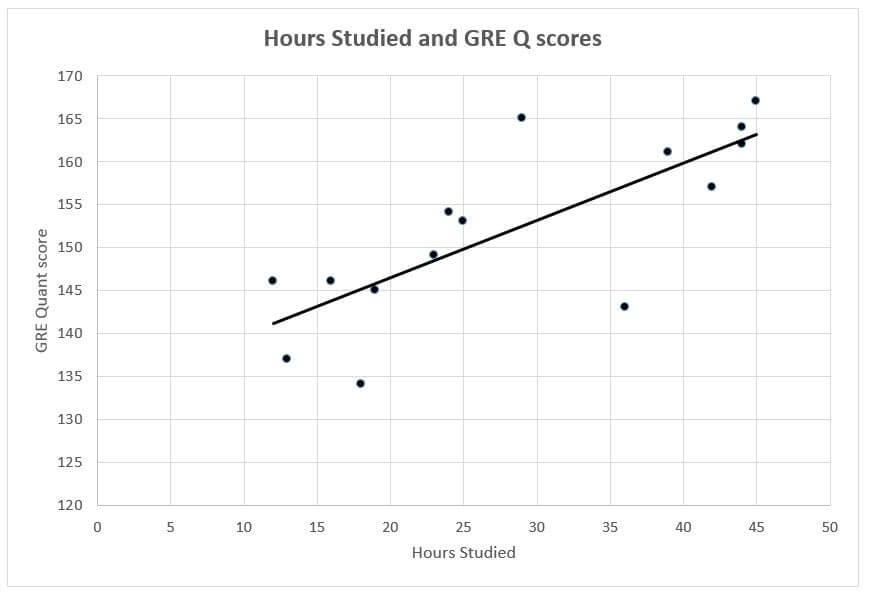
1) Among the students in this trial who studied less than 25 hours, what is the highest GRE Quant score achieved?
(A) 146
(B) 149
(C) 154
(D) 157
(E) 165
2) For the students in this trial with the three highest scores, approximately what is the average number of hours they spend studying?
(A) 29
(B) 32
(C) 35
(D) 39
(E) 43
3) Among the students in this trial who studied for 20 hours or more, what fraction of them performed worse than expected, according to the best-fit line model? Express your answer as a fraction.
(A) 146
(B) 149
(C) 154
(D) 157
(E) 165
Show: :: OA
C
2) For the students in this trial with the three highest scores, approximately what is the average number of hours they spend studying?
(A) 29
(B) 32
(C) 35
(D) 39
(E) 43
Show: :: OA
D
3) Among the students in this trial who studied for 20 hours or more, what fraction of them performed worse than expected, according to the best-fit line model? Express your answer as a fraction.
Show: :: OA
3/10
Show: ::
Attachment:
Hours-Studied-GRE-Q-score.jpg [ 24.96 KiB | Viewed 10229 times ]
Kudos for correct solution.
Re: Fifteen college seniors, none of whom took any math classes
[#permalink]
13 Oct 2017, 03:58
Answer
1 - C
2 - D
3 - 3/10
1 - C
2 - D
3 - 3/10
Re: Fifteen college seniors, none of whom took any math classes
[#permalink]
13 Oct 2017, 05:35
Rajneesh Garg wrote:
Answer
1 - C
2 - D
3 - 3/10
1 - C
2 - D
3 - 3/10
The OA's are already given. Please post solutions too. Thank you.

