GRE Prep Club Daily Prep
Thank you for using the timer - this advanced tool can estimate your performance and suggest more practice questions. We have subscribed you to Daily Prep Questions via email.
Customized
for You
Track
Your Progress
Practice
Pays
Not interested in getting valuable practice questions and articles delivered to your email? No problem, unsubscribe here.
A question related to Standard Deviation
[#permalink]
 11 May 2018, 03:33
1
3
Bookmarks
Question Stats:
 50% (01:16) correct
 50% (01:27) wrong
  based on 24 sessions
Hide Show timer Statistics
Hi everybody,
The following question is from Manhattan 5lb :

paint.jpg [ 19.59 KiB | Viewed 4944 times ]
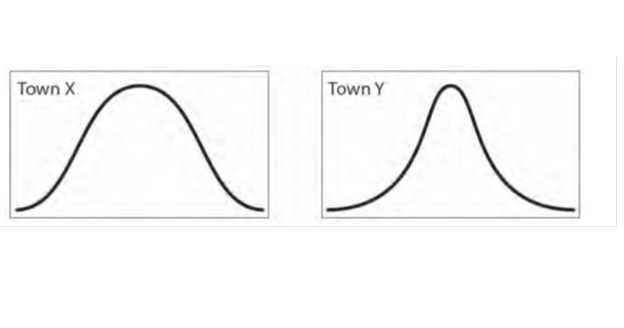
The graph on the left above represents the number of family members per family in Town X,while the graph on the right above represents the number of family members per family in Town Y.The median family size for Town X is equal to the median family size for Town Y. The horizontal and vertical dimensions of the boxes above are identical and correspond to the same measurements. Which of the following statements must be true?
Indicate \(all\) such statements.
1.The range of family sizes measured as the number of family members is larger in Town X than in Town Y.
2.Families in Town Y are more likely to have sizes within 1 family member of the mean than are families in Town X.
3.The data for Town X has a larger standard deviation than the data for Town Y
The following question is from Manhattan 5lb :
Attachment:
paint.jpg [ 19.59 KiB | Viewed 4944 times ]
The graph on the left above represents the number of family members per family in Town X,while the graph on the right above represents the number of family members per family in Town Y.The median family size for Town X is equal to the median family size for Town Y. The horizontal and vertical dimensions of the boxes above are identical and correspond to the same measurements. Which of the following statements must be true?
Indicate \(all\) such statements.
1.The range of family sizes measured as the number of family members is larger in Town X than in Town Y.
2.Families in Town Y are more likely to have sizes within 1 family member of the mean than are families in Town X.
3.The data for Town X has a larger standard deviation than the data for Town Y
Attachments
File comment: picture of graphs
![]() gre.docx [137.47 KiB]
gre.docx [137.47 KiB]
Downloaded 230 times
Re: A question related to Standard Deviation
[#permalink]
 11 May 2018, 04:23
1
Expert Reply
Lets go option by option
1. The range of family sizes measured as the number of family members is larger in Town X than in Town Y.
Range is the difference between the maximum and minimum values in a distribution. In this case maximum number of family members vs minimum number. Clearly both towns have the same maximum number of family member.
Since the width of both the graphs are same.
False
2.Families in Town Y are more likely to have sizes within 1 family member of the mean than are families in Town X.
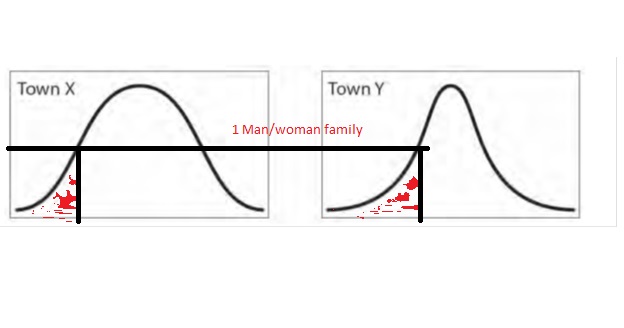
Look at the figure below. Say the line parallel to the y axis represent 1 family member family member in both graphs.

paint.jpg [ 25.96 KiB | Viewed 4927 times ]
So area under the curve bounded by the line is the total number of families with one family member or less (shown in red). Note that the line parallel to y axis is at the same distance from y axis in both cases.
Now area should be larger in Graph x is larger since graph x is more spread out than graph y and the median value is same for both (i.e. point on x axis where y is maximum).
True
3. The data for Town X has a larger standard deviation than the data for Town Y
Standard deviation is the thickness of the graph. Larger the standard deviation more spread out the graph would be. In this case X is more spread out than Y.
True.
1. The range of family sizes measured as the number of family members is larger in Town X than in Town Y.
Range is the difference between the maximum and minimum values in a distribution. In this case maximum number of family members vs minimum number. Clearly both towns have the same maximum number of family member.
Since the width of both the graphs are same.
False
2.Families in Town Y are more likely to have sizes within 1 family member of the mean than are families in Town X.
Look at the figure below. Say the line parallel to the y axis represent 1 family member family member in both graphs.
Attachment:
paint.jpg [ 25.96 KiB | Viewed 4927 times ]
So area under the curve bounded by the line is the total number of families with one family member or less (shown in red). Note that the line parallel to y axis is at the same distance from y axis in both cases.
Now area should be larger in Graph x is larger since graph x is more spread out than graph y and the median value is same for both (i.e. point on x axis where y is maximum).
True
3. The data for Town X has a larger standard deviation than the data for Town Y
Standard deviation is the thickness of the graph. Larger the standard deviation more spread out the graph would be. In this case X is more spread out than Y.
True.
Re: A question related to Standard Deviation
[#permalink]
 11 May 2018, 07:22
sandy wrote:
Lets go option by option
1. The range of family sizes measured as the number of family members is larger in Town X than in Town Y.
Range is the difference between the maximum and minimum values in a distribution. In this case maximum number of family members vs minimum number. Clearly both towns have the same maximum number of family member.
Since the width of both the graphs are same.
False
2.Families in Town Y are more likely to have sizes within 1 family member of the mean than are families in Town X.
Look at the figure below. Say the line parallel to the y axis represent 1 family member family member in both graphs.
So area under the curve bounded by the line is the total number of families with one family member or less (shown in red). Note that the line parallel to y axis is at the same distance from y axis in both cases.
Now area should be larger in Graph x is larger since graph x is more spread out than graph y and the median value is same for both (i.e. point on x axis where y is maximum).
True
3. The data for Town X has a larger standard deviation than the data for Town Y
Standard deviation is the thickness of the graph. Larger the standard deviation more spread out the graph would be. In this case X is more spread out than Y.
True.
1. The range of family sizes measured as the number of family members is larger in Town X than in Town Y.
Range is the difference between the maximum and minimum values in a distribution. In this case maximum number of family members vs minimum number. Clearly both towns have the same maximum number of family member.
Since the width of both the graphs are same.
False
2.Families in Town Y are more likely to have sizes within 1 family member of the mean than are families in Town X.
Look at the figure below. Say the line parallel to the y axis represent 1 family member family member in both graphs.
Attachment:
paint.jpg
So area under the curve bounded by the line is the total number of families with one family member or less (shown in red). Note that the line parallel to y axis is at the same distance from y axis in both cases.
Now area should be larger in Graph x is larger since graph x is more spread out than graph y and the median value is same for both (i.e. point on x axis where y is maximum).
True
3. The data for Town X has a larger standard deviation than the data for Town Y
Standard deviation is the thickness of the graph. Larger the standard deviation more spread out the graph would be. In this case X is more spread out than Y.
True.
Dear Sandy,
Thanks a lot for the wonderful explanation. I doubted on "B" since I thought that I should consider the percent of the numbers that are within one SD that is equal for both cities (i.e. 68%).
Thank you.


