GRE Prep Club Daily Prep
Thank you for using the timer - this advanced tool can estimate your performance and suggest more practice questions. We have subscribed you to Daily Prep Questions via email.
Customized
for You
Track
Your Progress
Practice
Pays
Not interested in getting valuable practice questions and articles delivered to your email? No problem, unsubscribe here.
Which of the following gives the range of the median number of hours o
[#permalink]
 26 Nov 2024, 01:17
Expert Reply
1
Bookmarks
Question Stats:
 68% (01:10) correct
 31% (00:54) wrong
  based on 19 sessions
Hide Show timer Statistics
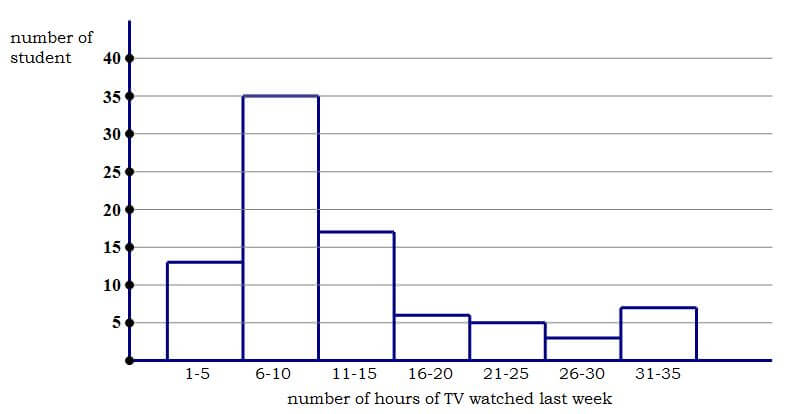
In a survey, 82 high school students were randomly selected and asked how many hours of television they had watched in the previous week. The histogram below displays their answers.

Which of the following gives the range of the median number of hours of TV watched last week?
A. 1-5
B. 6-10
C. 11-15
D. 16-20
E. 41-45
Which of the following gives the range of the median number of hours of TV watched last week?
A. 1-5
B. 6-10
C. 11-15
D. 16-20
E. 41-45
- Part of the project: GRE Quant & Verbal ADVANCED Daily Challenge 2024 Edition - Gain 20 Kudos & Get FREE Access to GRE Prep Club TESTS
- Also replying to the unanswered questions
Which of the following gives the range of the median number of hours o
[#permalink]
 21 Dec 2024, 13:17
Expert Reply
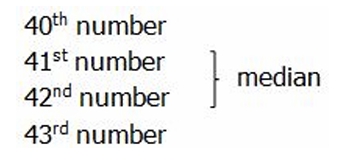
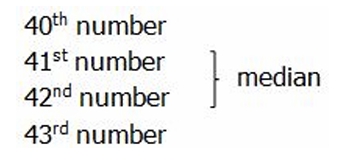
The median of a list is the middle value, when all the values in the list are put in order from smallest to biggest. Here, we are concerned with the 82 high school students --- for each, we have a number: the number of hours of TV they watched last week. Since 82 is an even number, the median would be the average of the middle two numbers, the average of 41st and 42nd numbers.
1st number
2nd number
3rd number
.
.
.

.
.
.
80th number
81st number
82nd number
Here, we don't have any of the individual numbers, only their groupings, but we can figure out where the 41st and 42nd numbers would be. Clearly, the first column is 13 units high, we means it contains the first 13 numbers on the list. The second column is 35 units high --- 13 + 35 = 48, so that's the first 48 numbers on the list. If we count all the way down to the 48th number on the list, that means we have already passed the 41st and 42nd numbers, which means the median must be included in the numbers in the second column. Answer = (B).

GRE median (3).jpg [ 29.12 KiB | Viewed 1665 times ]
1st number
2nd number
3rd number
.
.
.
.
.
.
80th number
81st number
82nd number
Here, we don't have any of the individual numbers, only their groupings, but we can figure out where the 41st and 42nd numbers would be. Clearly, the first column is 13 units high, we means it contains the first 13 numbers on the list. The second column is 35 units high --- 13 + 35 = 48, so that's the first 48 numbers on the list. If we count all the way down to the 48th number on the list, that means we have already passed the 41st and 42nd numbers, which means the median must be included in the numbers in the second column. Answer = (B).
Show: ::
Attachment:
GRE median (3).jpg [ 29.12 KiB | Viewed 1665 times ]
Re: Which of the following gives the range of the median number of hours o
[#permalink]
 16 Nov 2025, 00:26
Carcass as 82 is a total number of students and we need to find "range of the median number of hours of TV" by taking median of students we will only get the median of students how can we conclude the "range of the median number of hours of TV" through that ?


