GRE Prep Club Daily Prep
Thank you for using the timer - this advanced tool can estimate your performance and suggest more practice questions. We have subscribed you to Daily Prep Questions via email.
Customized
for You
Track
Your Progress
Practice
Pays
Not interested in getting valuable practice questions and articles delivered to your email? No problem, unsubscribe here.
The following pie chart shows the breakdown of revenues for
[#permalink]
 11 Oct 2017, 21:14
1
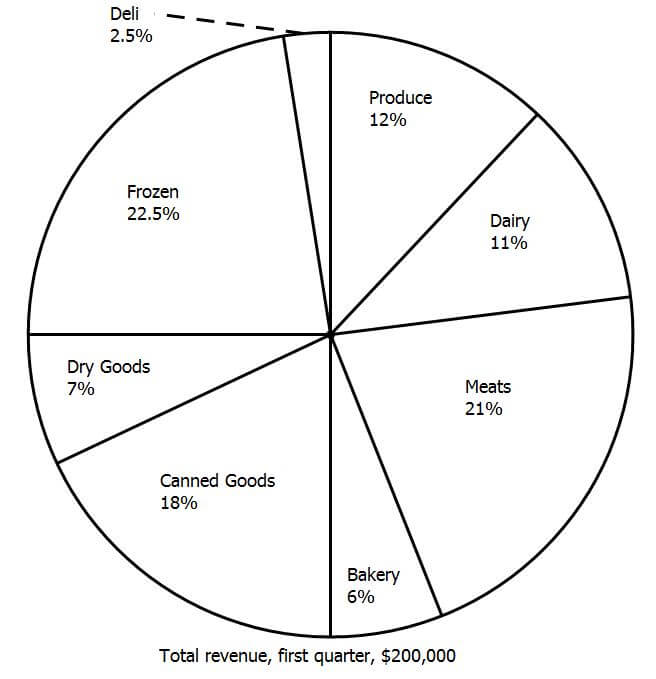
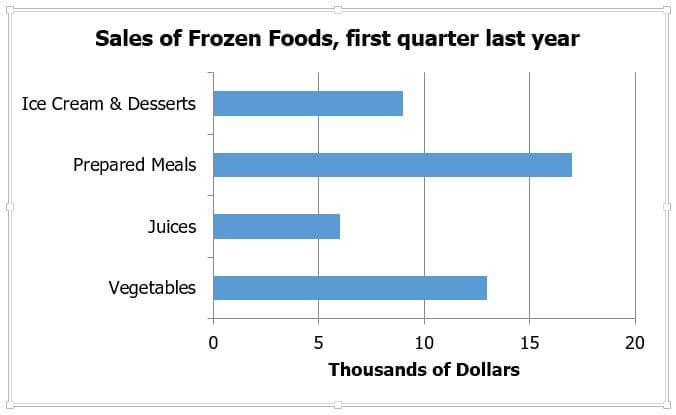
The following pie chart shows the breakdown of revenues for a particular grocery store over the first quarter of last year. The bar chart shows the detail of breakdown for frozen foods.


1) What is the dollar amount of sales of canned goods in the first quarter of last year?
(A) $6,000
(B) $9,000
(C) $18,000
(D) $36,000
(E) $90,000
2) Frozen prepared meals constitute what percentage of the total sales for the first quarter last year?
(A) 2.4%
(B) 8.5%
(C) 20%
(D) 36%
(E) 54%
3) During the first quarter last year, this particular grocery store was finishing its construction of an expanded bakery facility, which, when opened at the beginning the second quarter, will offer dozens of new cakes and pies, a whole new line of pastries, and several flavors of gourmet coffee. In the first quarter, bakery sales represented 6% of total profits. Assume that in the second quarter, the bakery sales triple, and all other sale stay the same. Bakery would then account for what percentage of total sales in the second quarter?
(A) 12%
(B) 14.3%
(C) 16.1%
(D) 18%
(E) 25.3%
Kudos for correct solution.
Show: ::
Attachment:
pie-chart-grocery-store.jpg [ 24.56 KiB | Viewed 84501 times ]
Attachment:
bar-chart-groceries.jpg [ 17.63 KiB | Viewed 84488 times ]
Re: The following pie chart shows the breakdown of revenues for
[#permalink]
 15 Oct 2017, 01:26
2
Q1: from the pie chart, canned goods are 18% of the total sale of 200,000 dollars. Thus, its value is 0.18*200,000 = 36,000 dollars (D)
Q2: prepared meals are roughly 17,000 dollars out of a total of 200,000, thus the percentage is (17,000/200,000)*100 = 8.5% (B)
Q3: that's a tricky one. If the sales of bakery tripled in the second quarter, it means they become 0.06*200,000 = 12,000 times three, 36,000 dollars. Now, we have to pay attention that although all the other sales stay the same, the one of bakery increased by 24,000 dollars between the two quarters. Than, when computing the ratio we have to pay attention to increase the denominator by 24,000.
In other words, the share of bakery sales in the second quarter is 36,000/(200,000+24,000)*100 = 16.1%. (C)
Re: The following pie chart shows the breakdown of revenues for
[#permalink]
 05 Dec 2017, 06:38
3
1) From the pie chart, we know that the total revenue was $200.000. The pie chart also shows that 18% of the total revenue came from canned goods. All we need to do here is find out how much 18% of $200.000 is:
(200.000 * 18)/100 = 36,000
You can also do this in your head:
18% of 200.000 = (20% of 200.000) - (2% of 200.000)
40.000 - 4.000
=36,000
Answer D
2) The bar chart shows that $17,000 of the entire revenue ($200,000) came from prepared meals:
(17.000/200.000) * 100 = 8.5%
We can do this one mentally too. 10% of 200.000 is 20.000. 17.000 is pretty close from 20.000 so you know the percentage will be less than 10% but close to 10%. The only option would be 8.5%.
Answer B
3) This one can be an issue if you don't pay attention. You may be tempted to multiply 6% by 3 to get 18% but you cannot do that. The question states that none of the other things on the pie chart will have changed. If you add the 18% to the other unchanged values on the pie chart, you will get a result that is more than 100% which is impossible for a pie chart.
You first need to figure out how much 6% is of the total revenue(200,000):
(200.000 * 6)/100 = 12,000
This means that of the $200,000, $12,000 came from the bakery.
Now we multiply 12.000 by 3:
12.000 * 3 = 36.000
This means that the revenue that will be cr4eated by the bakery is %36.000.
Now you need to figure out the new revenue with the new bakery. The other items did not sale more or less so no change there. The only change was the bakery that now sold $36,000 instead of $12,000. You may be tempted to add 200.000 to 36.000 but keep in mind that $12,000 WAS ALREADY part of the original revenue ($200.000). You just need to add HOW MUCH MORE the bakery sold after its sales trippled which is $24.000:
200.000 + 24.000 = 224.000
The new revenue after the sales from the bakery trippled is $224.000.
Now you just need to figure out how much in percentage 36.000 is from 224.000:
(36.000/224.000) * 100 = 16.1
This means that 16.1% of the total revenue came from the bakery sales.
Answer C
My explanation is a bit long-winded but personally, I need to do math step by steo to understand.


