
GRE Prep Club Daily Prep
Thank you for using the timer - this advanced tool can estimate your performance and suggest more practice questions. We have subscribed you to Daily Prep Questions via email.
Customized
for You
Track
Your Progress
Practice
Pays
Not interested in getting valuable practice questions and articles delivered to your email? No problem, unsubscribe here.
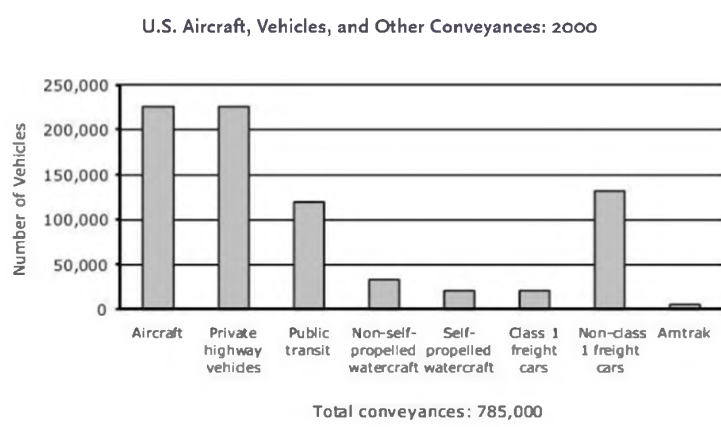
U.S. Aircraft, Vehicles, and Other Conveyances: 2000
[#permalink]
 21 Oct 2017, 03:43
Expert Reply
1
Bookmarks

00:00
Question Stats:
 100% (05:46) correct
0% (00:00) wrong based on 11 sessions
100% (05:46) correct
0% (00:00) wrong based on 11 sessions
Hide Show timer Statistics
U.S. Aircraft, Vehicles, and Other Conveyances: 2000
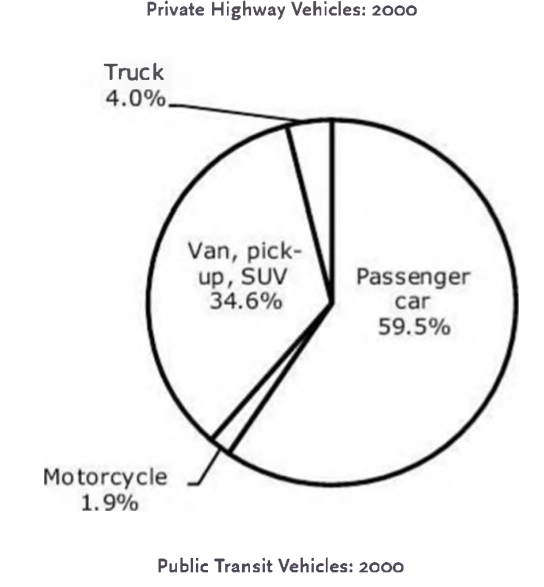
 Private Highway Vehicles: 2000
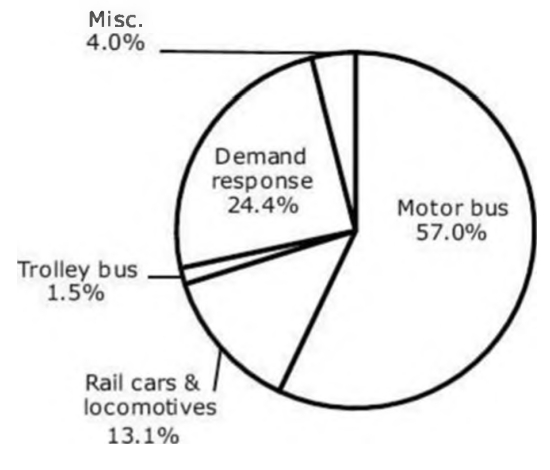
 Public Transit Vehicles: 2000
Approximately what was the ratio of trucks to passenger cars?
(A) 1 to 20
(B) 1 to 18
(C) 1 to 17
(D) 1 to 15
(E) 1 to 12
Approximately how many more miscellaneous public transit vehicles than public transit trolley buses were there in 2000?
(A) 1,000
(B) 1,500
(C) 2,000
(D) 2,500
(E) 3,000
If the number of aircraft, vehicles, and other conveyances was 572,000 in 1995, what was the approximate percentage increase from 1995 to 2000?
(A) 37%
(B) 32%
(C) 27%
(D) 20 %
(E) 15%
In 2000, if an equal percentage of passenger cars and demand-response vehicles experienced mechanical problems, and the number of passenger cars that experienced such problems was 13,436, approximately how many demand- response vehicles experienced mechanical problems?
(A) 1,352
(B) 2,928
(C) 4,099
(D) 7,263
(E) 9,221
(A) 1 to 20
(B) 1 to 18
(C) 1 to 17
(D) 1 to 15
(E) 1 to 12
Show: :: OA
D
Approximately how many more miscellaneous public transit vehicles than public transit trolley buses were there in 2000?
(A) 1,000
(B) 1,500
(C) 2,000
(D) 2,500
(E) 3,000
Show: :: OA
E
If the number of aircraft, vehicles, and other conveyances was 572,000 in 1995, what was the approximate percentage increase from 1995 to 2000?
(A) 37%
(B) 32%
(C) 27%
(D) 20 %
(E) 15%
Show: :: OA
A
In 2000, if an equal percentage of passenger cars and demand-response vehicles experienced mechanical problems, and the number of passenger cars that experienced such problems was 13,436, approximately how many demand- response vehicles experienced mechanical problems?
(A) 1,352
(B) 2,928
(C) 4,099
(D) 7,263
(E) 9,221
Show: :: OA
B
Show: ::
Attachment:
#GREpracticequestion If the number of aircraft, vehicles,.jpg [ 62.66 KiB | Viewed 8795 times ]
Attachment:
#GREpracticequestion Approximately how many more miscellaneous public transit.jpg [ 70.84 KiB | Viewed 8917 times ]
Attachment:
#GREpracticequestion Approximately what was the ratio of trucks to passenger cars.jpg [ 92.69 KiB | Viewed 8847 times ]


Re: U.S. Aircraft, Vehicles, and Other Conveyances: 2000
[#permalink]
08 Mar 2018, 03:00
4
1. Realize that both passenger cars and trucks are part of private vehicles. Hence instead of calculating percentage of each and referring to the graph for the number of private vehicles and then cancelling at the end, simply making the ratio of given % of each will lead to faster result. \(\frac{4}{60}\) (\(59.5\) is approx \(60\))= \(\frac{1}{15}\)
2.In the bar graph approximately \(120000\)public vehicles were there in 2005. Checking the pie chart for public vehicles only Misc is \(4% of 120000 = 4800\) and trolley bus is \(1.5% of 120000 = 1800\)
Hence \(4800 - 1800 = 3000\)
3. Given, \(1995 = 572000; 2005 = 785000\)
Hence % increase = \(\frac{785000 - 572000}{572000} * 100 = 37.23%\) approx \(37%\)
4. This is slightly tough as both pie charts and the bar graph has to be referred for answers.
First of all find out the total number of passenger cars = \(60% of 225000 = 135000\) [Here \(225000\) is approximately the number of total private vehicles]
Now Find the ratio of malfunctioning cars to total = \(\frac{13436}{135000} = 0.099\) approximately =\(0.10\)
Now refer the bar graph again and the total number of public vehicle is approximately \(120000\)
Demand response vehicle from the pie chart is \(24.4% of 120000 = 29280\) now if \(0.10\) of these vehicles had mechanical failure than the total number of such vehicle would be
\(29280*0.10 = 2928\)
Re: U.S. Aircraft, Vehicles, and Other Conveyances: 2000
[#permalink]
09 Sep 2018, 17:05
My answer for 4th question for a little further than correct answer but I could approximate it. I got around 2500 vehicles with mechanical failures.
Private vehicles= 225000. Passenger cars= 0.595 * 225000=133875
Public vehicles= 125000. Demand response cars= 0.244*125000=30500
Now, let x be the same % of cars with mechanical failures. That means 1338.75x+305x=13436
x=8.17% Demand response cars with mechanical failures is 305*8.17=2491 which is closer to 2928 from the options

