
GRE Prep Club Daily Prep
Thank you for using the timer - this advanced tool can estimate your performance and suggest more practice questions. We have subscribed you to Daily Prep Questions via email.
Customized
for You
Track
Your Progress
Practice
Pays
Not interested in getting valuable practice questions and articles delivered to your email? No problem, unsubscribe here.
If all four stores earned exactly the same amount of total r
[#permalink]
 23 Nov 2020, 10:58
1
Expert Reply

00:00
Question Stats:
 78% (01:14) correct
21% (01:00) wrong based on 38 sessions
78% (01:14) correct
21% (01:00) wrong based on 38 sessions
Hide Show timer Statistics
The following data, which shows the percentage of revenue earned from three different categories of product sold by four different grocery stores. Figures at left are
percentages. Each store received revenue only from the three categories depicted: Beverages, Packaged Food, and Prepared Food.
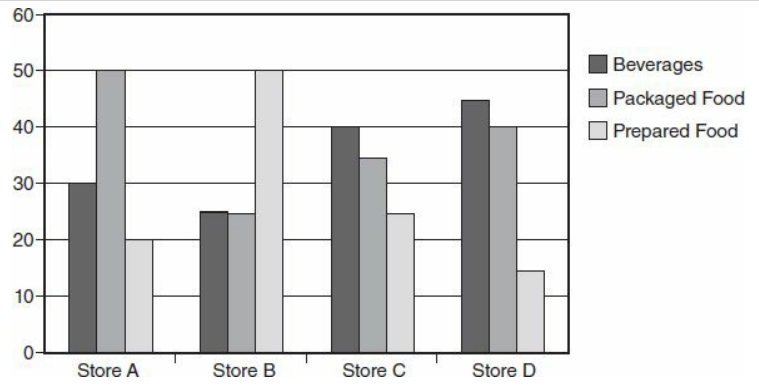
If all four stores earned exactly the same amount of total revenue, what percentage of the total revenue of the four stores combined came from beverages?
A. 27.5%
B. 30%
C. 35%
D. 37.5%
E. 40%
percentages. Each store received revenue only from the three categories depicted: Beverages, Packaged Food, and Prepared Food.
If all four stores earned exactly the same amount of total revenue, what percentage of the total revenue of the four stores combined came from beverages?
A. 27.5%
B. 30%
C. 35%
D. 37.5%
E. 40%

Re: If all four stores earned exactly the same amount of total r
[#permalink]
01 Jan 2021, 08:24
Let's say all the stores earned 100$ .
Beverages revenue for
store A - 30
store B - 25
store C - 40
store D - 45
Total is 140 from beverages.
% share of beverages = \(\frac{140}{400}\)
= 35%
Answer C
Beverages revenue for
store A - 30
store B - 25
store C - 40
store D - 45
Total is 140 from beverages.
% share of beverages = \(\frac{140}{400}\)
= 35%
Answer C


If all four stores earned exactly the same amount of total r
[#permalink]
03 Feb 2021, 23:15
1
Best way to approach such question is to eliminate what we do not need and save time. Since the question is looking for beverage consumption we do not need to look at the graph for other two items i.e. Packaged food and Prepared food.
This is not an official question because there is a margin of error possibility between option C and D and it really depends on the eyes of the test taker. See how revenue for beverage for Store B can easily be interpreted as 26% rather than 25%.
Coming to the question:
Let us assume each store makes a sale of equal amount, take $100 for easy computation.
That makes beverage sales by 4 store as $30, $25, $40, $45
Bringing the % share of beverage as: \(\frac{140}{400}\) * 100 = 35%

