GRE Prep Club Daily Prep
Thank you for using the timer - this advanced tool can estimate your performance and suggest more practice questions. We have subscribed you to Daily Prep Questions via email.
Customized
for You
Track
Your Progress
Practice
Pays
Not interested in getting valuable practice questions and articles delivered to your email? No problem, unsubscribe here.
What was the quiz score of the student whose score least fit the gener
[#permalink]
 16 Mar 2021, 06:21
Expert Reply
1
Bookmarks
Question Stats:
 93% (00:39) correct
 6% (00:45) wrong
  based on 32 sessions
Hide Show timer Statistics
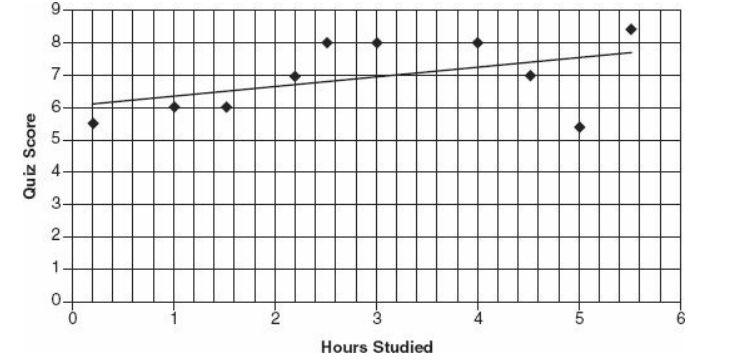
The number of hours that 10students studied for a quiz plotted against each student’s subsequent quiz score. The line of best fit (trend line) has been plotted for the data. Each dot represents an individual student.

GRE What was the quiz score of the.jpg [ 100.35 KiB | Viewed 5527 times ]
What was the quiz score of the student whose score least fit the general pattern of data?
5
5.5
6
7
8
Kudos for the right answer and explanation
Question part of the project GRE Quantitative Reasoning Daily Challenge - (2021) EDITION
GRE - Math Book
Attachment:
GRE What was the quiz score of the.jpg [ 100.35 KiB | Viewed 5527 times ]
What was the quiz score of the student whose score least fit the general pattern of data?
5
5.5
6
7
8
Kudos for the right answer and explanation
Question part of the project GRE Quantitative Reasoning Daily Challenge - (2021) EDITION
GRE - Math Book
Retired Moderator
Joined: 16 Apr 2020
Status:Founder & Quant Trainer
Affiliations: Prepster Education
Posts: 1546
Given Kudos: 172
Location: India
WE:Education (Education)
Re: What was the quiz score of the student whose score least fit the gener
[#permalink]
 16 Mar 2021, 07:34
1
Carcass wrote:
The number of hours that 10students studied for a quiz plotted against each student’s subsequent quiz score. The line of best fit (trend line) has been plotted for the data. Each dot represents an individual student.
What was the quiz score of the student whose score least fit the general pattern of data?
5
5.5
6
7
8
Attachment:
GRE What was the quiz score of the.jpg
What was the quiz score of the student whose score least fit the general pattern of data?
5
5.5
6
7
8
Quiz score of the student whose score least fit the general pattern of data means the point which has the maximum error % or is farthest from the line of best fit!
So the point plotted on 5 hours has the maximum error and has 5.5 quiz score against it
Hence, option B
Re: What was the quiz score of the student whose score least fit the gener
[#permalink]
 27 Apr 2021, 11:40
But 5.5 is also the score of first student whose score fits well with the general pattern of data?!


