GRE Prep Club Daily Prep
Thank you for using the timer - this advanced tool can estimate your performance and suggest more practice questions. We have subscribed you to Daily Prep Questions via email.
Customized
for You
Track
Your Progress
Practice
Pays
Not interested in getting valuable practice questions and articles delivered to your email? No problem, unsubscribe here.
The figure shows the graphs of functions f and g, defin
[#permalink]
 24 Feb 2022, 08:15
Expert Reply
11
Bookmarks
Question Stats:
 35% (01:41) correct
 64% (02:46) wrong
  based on 14 sessions
Hide Show timer Statistics
Attachment:
GRe The figure shows the.jpg [ 18.72 KiB | Viewed 3305 times ]
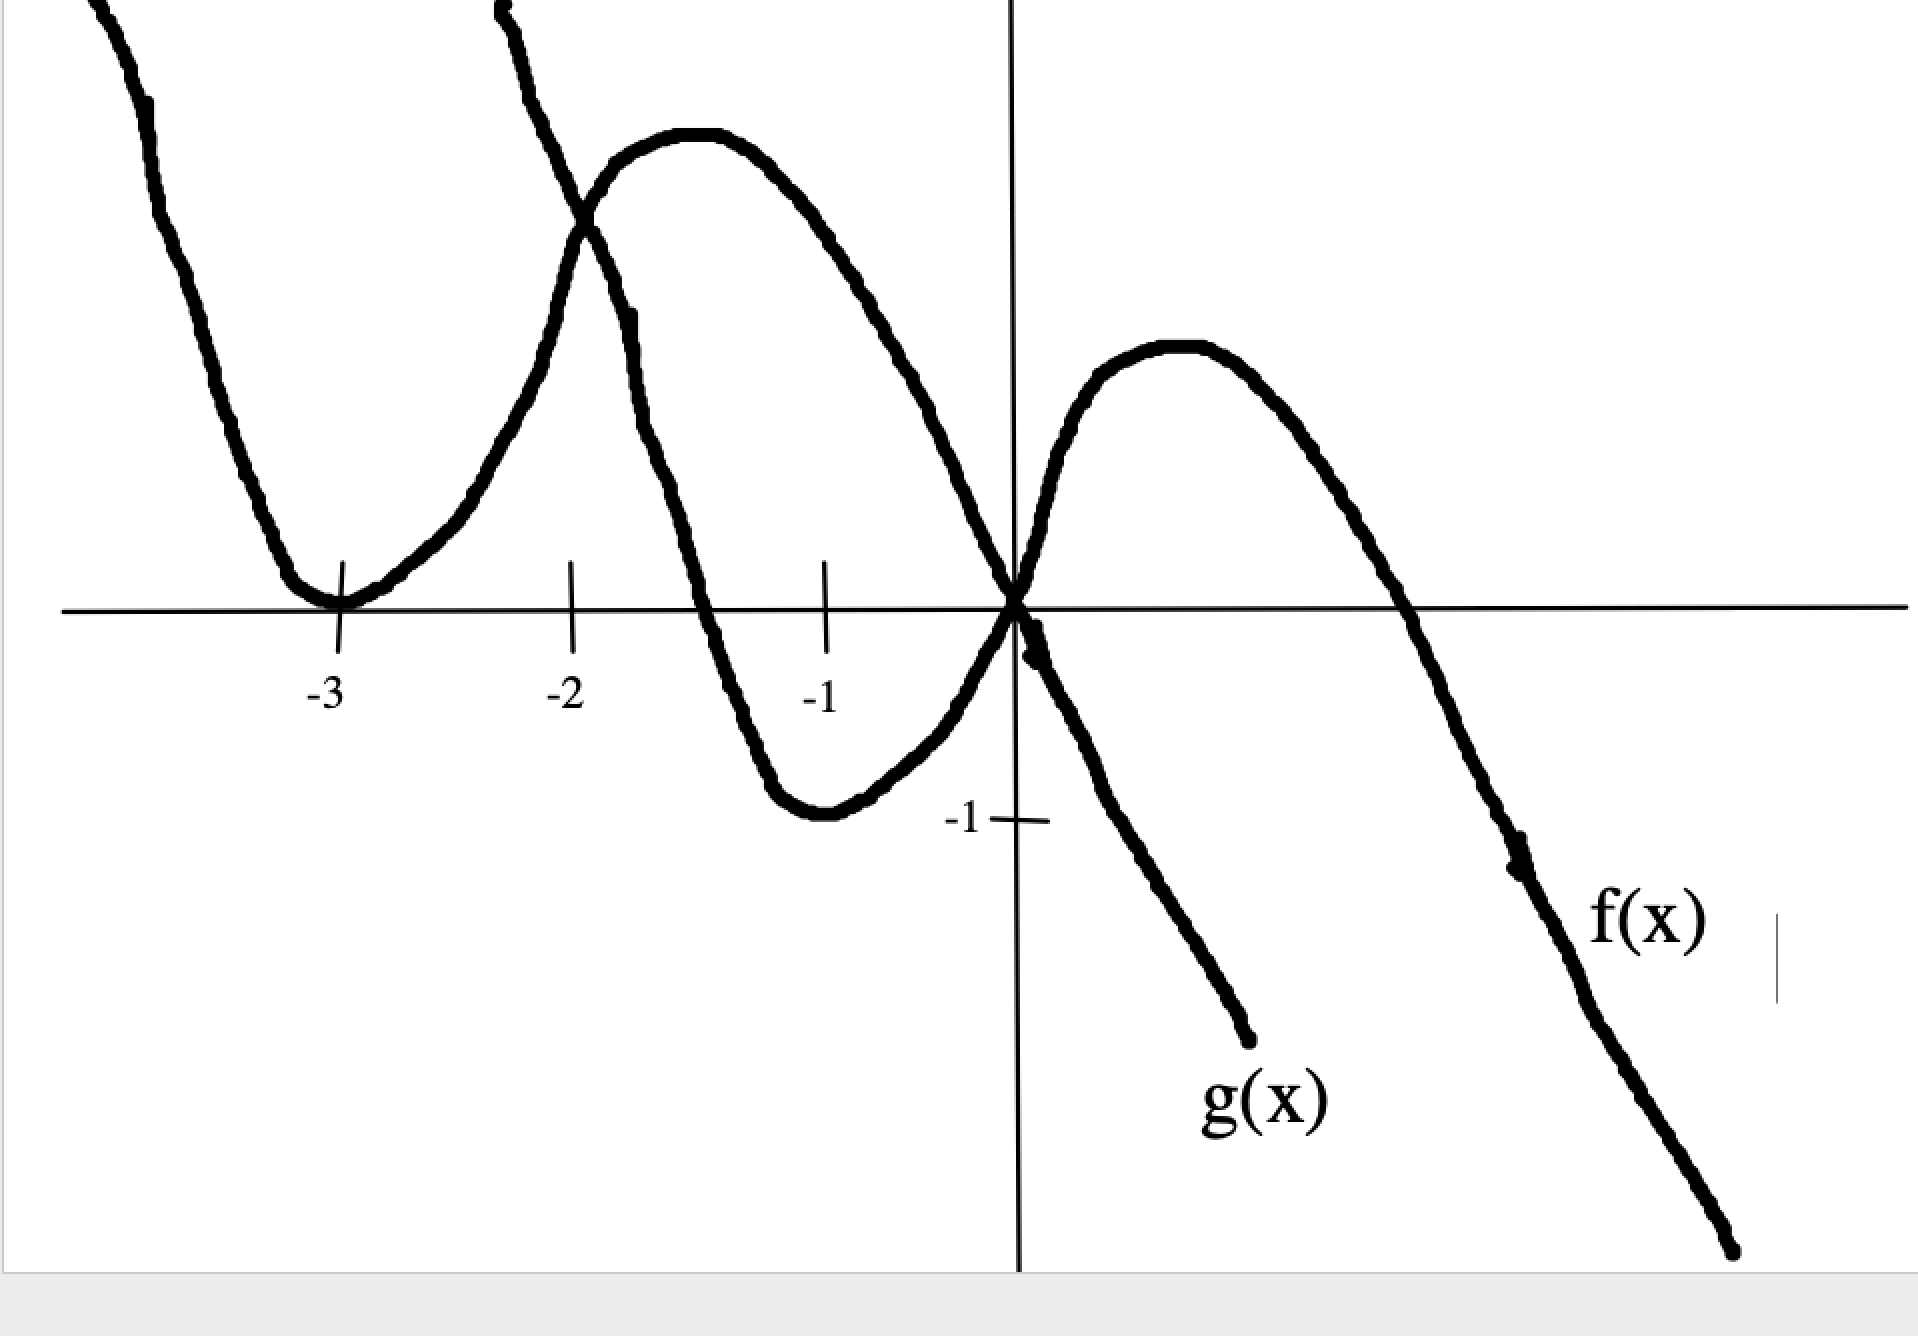
The figure shows the graphs of functions f and g, defined by \(f(x) = -x^3 + x\) and \(g(x) = f(x + m) + n\), where m and n are constants. What is \(m + n\)?
Show: ::
3
The figure shows the graphs of functions f and g, defin
[#permalink]
 Updated on: 31 Oct 2022, 08:08
2
4
Bookmarks
The given figure does not show an accurate graph for f(x) = -x^3 + x and thus does not seem viable.
Whereas the local minimum for f(x) = -x^3 + x is -2/(3√3) ≈ -0.38, the graph seems to show a local minimum near or at -1.
Also, coordinate plane in the figure is distorted in that the vertical distance between 0 and -1 seems much smaller than the horizontal distance between 0 and -1.
To avoid confusion, I would ignore the problem as written.
I believe that the following revision reflects the intent of the problem.

Screen Shot 2022-10-30 at 4.39.21 PM.png [ 144.08 KiB | Viewed 2408 times ]
The figure shows the graphs of f(x) and g(x), where g(x) = f(x + m) + n and m and n are constants. What is m + n?
Given any function f(x):
f(x) + 10 --> the graph shifts UP 10 places
f(x) - 10 --> the graph shifts DOWN 10 places
f(x-10) --> the graph shifts to the RIGHT 10 places
f(x+10) --> the graph shifts to the LEFT 10 places

Screen Shot 2022-10-30 at 4.41.49 PM.png [ 146.59 KiB | Viewed 2401 times ]
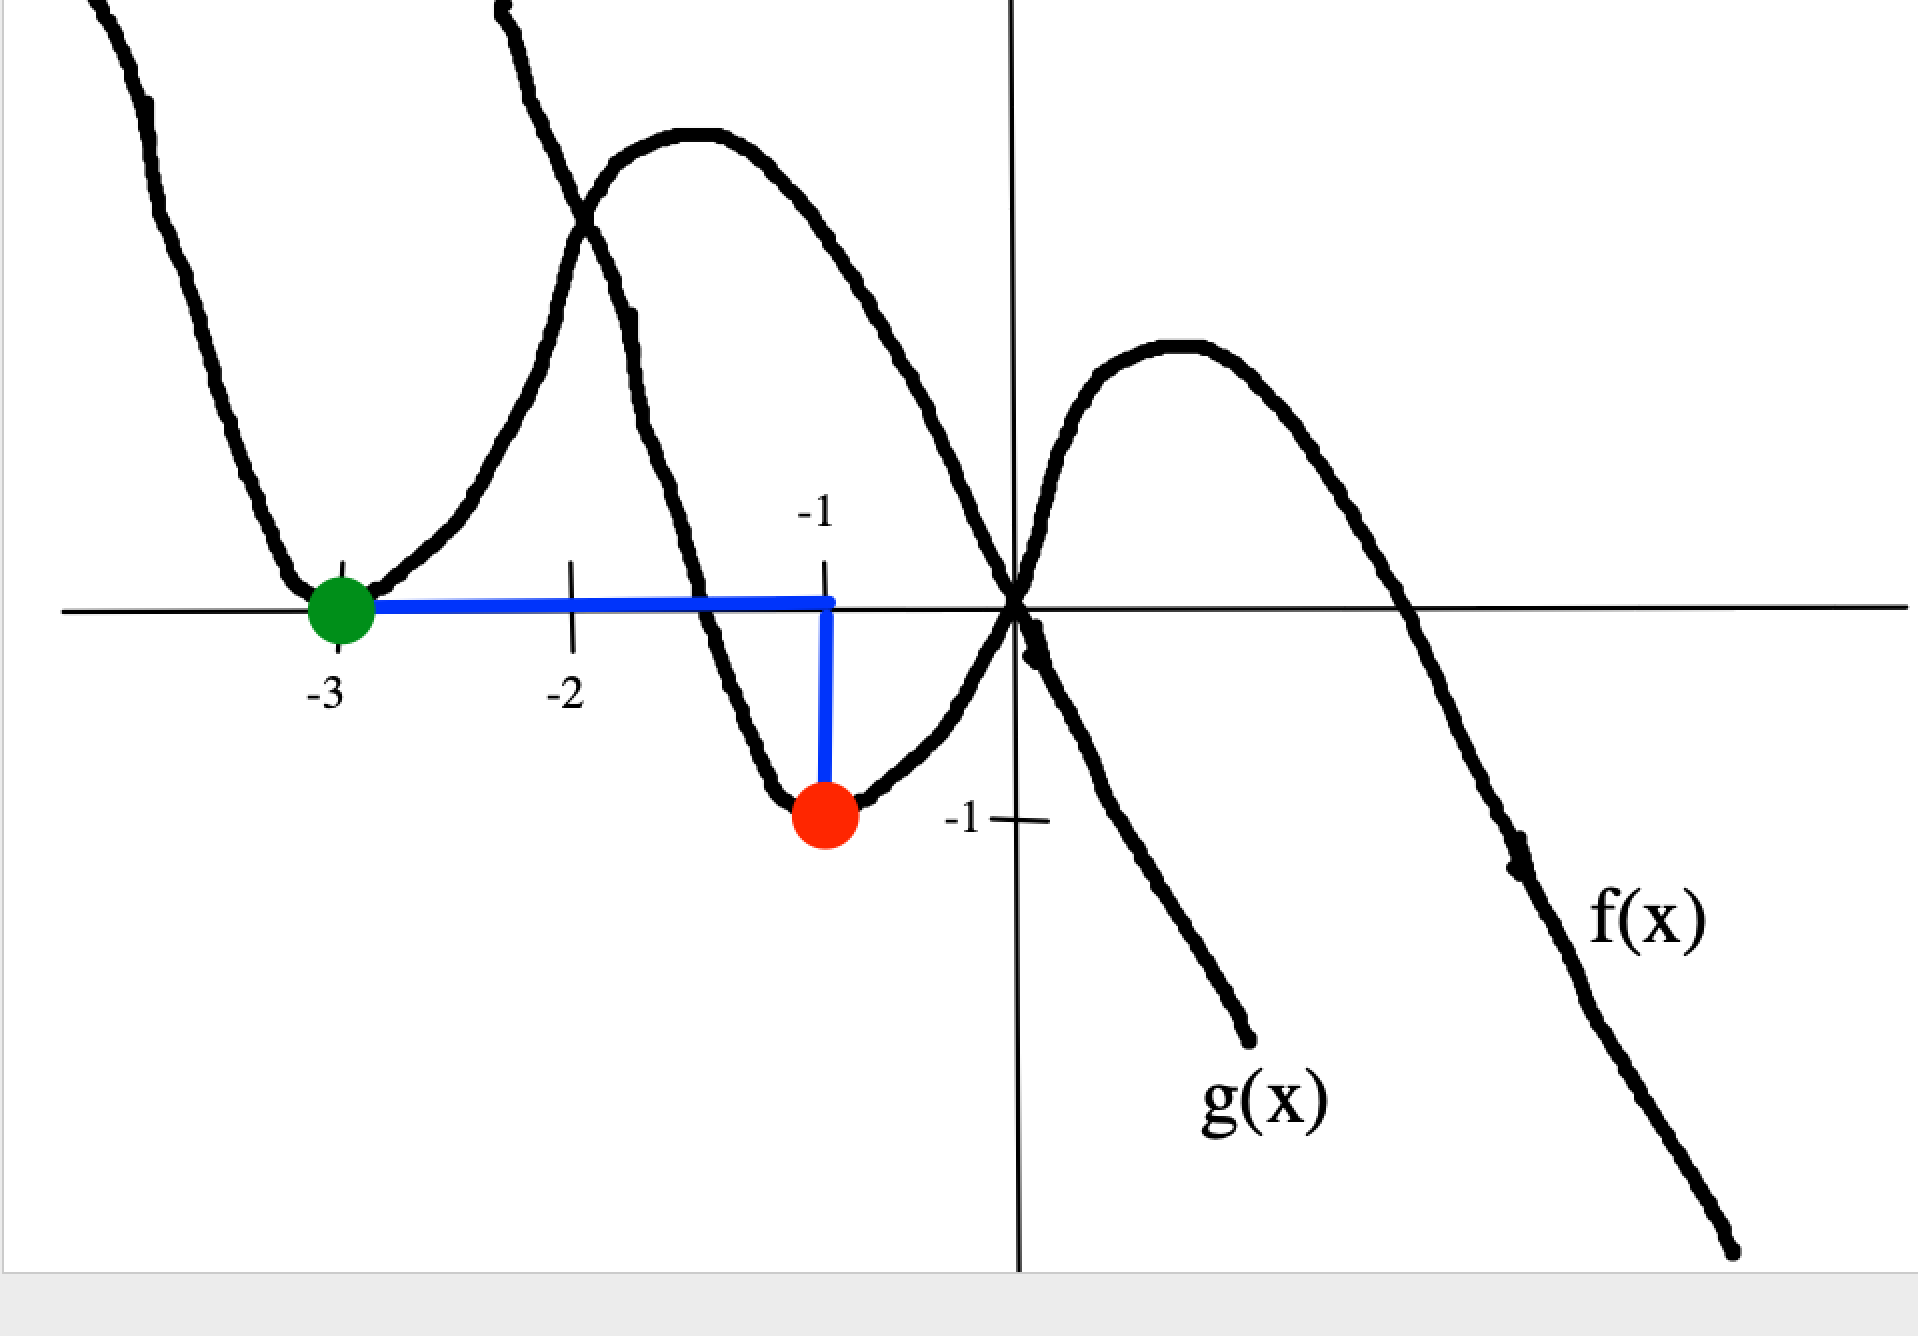
The red dot on f(x) moves up 1 place and to the left 2 places to become the green dot on g(x).
Since g(x) shifts the graph of f(x) up 1 place, n=1.
Since g(x) shifts the graph of f(x) to the left 2 places, m=2.
Thus:
m+n = 2 + 1 = 3
Whereas the local minimum for f(x) = -x^3 + x is -2/(3√3) ≈ -0.38, the graph seems to show a local minimum near or at -1.
Also, coordinate plane in the figure is distorted in that the vertical distance between 0 and -1 seems much smaller than the horizontal distance between 0 and -1.
To avoid confusion, I would ignore the problem as written.
I believe that the following revision reflects the intent of the problem.
Quote:
Attachment:
Screen Shot 2022-10-30 at 4.39.21 PM.png [ 144.08 KiB | Viewed 2408 times ]
The figure shows the graphs of f(x) and g(x), where g(x) = f(x + m) + n and m and n are constants. What is m + n?
Given any function f(x):
f(x) + 10 --> the graph shifts UP 10 places
f(x) - 10 --> the graph shifts DOWN 10 places
f(x-10) --> the graph shifts to the RIGHT 10 places
f(x+10) --> the graph shifts to the LEFT 10 places
Attachment:
Screen Shot 2022-10-30 at 4.41.49 PM.png [ 146.59 KiB | Viewed 2401 times ]
The red dot on f(x) moves up 1 place and to the left 2 places to become the green dot on g(x).
Since g(x) shifts the graph of f(x) up 1 place, n=1.
Since g(x) shifts the graph of f(x) to the left 2 places, m=2.
Thus:
m+n = 2 + 1 = 3
Originally posted by GMATGuruNY on 24 Feb 2022, 14:22.
Last edited by GMATGuruNY on 31 Oct 2022, 08:08, edited 3 times in total.
Last edited by GMATGuruNY on 31 Oct 2022, 08:08, edited 3 times in total.
General Discussion
Re: The figure shows the graphs of functions f and g, defin
[#permalink]
 30 Oct 2022, 11:01
Hi the red dot in fact moves more then 2 places in x, doesnt it? since it starts out at -1 < x < 0 and ends up at -3.


