GRE Prep Club Daily Prep
Thank you for using the timer - this advanced tool can estimate your performance and suggest more practice questions. We have subscribed you to Daily Prep Questions via email.
Customized
for You
Track
Your Progress
Practice
Pays
Not interested in getting valuable practice questions and articles delivered to your email? No problem, unsubscribe here.
The graph below represents a professional football league's
[#permalink]
 21 Nov 2018, 00:07
Expert Reply
Question Stats:
 66% (01:27) correct
 33% (01:25) wrong
  based on 9 sessions
Hide Show timer Statistics
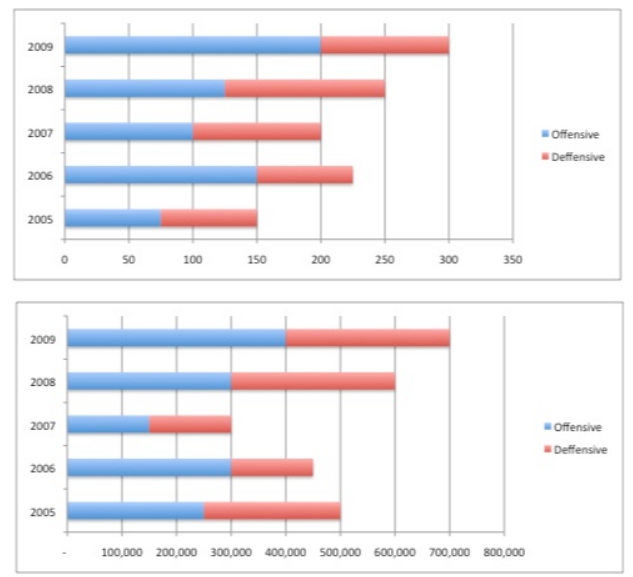
The graph below represents a professional football league's total scouting make up for all teams. The top graph shows the total number of scouts working for the league in the categories of Offensive and Defensive players. The second graph illustrates their total compensation in thousands of dollars.

GRE - The graph below represents a professional football league's total .jpg [ 96.93 KiB | Viewed 3799 times ]
By what percent did the total number of defensive scouts increase from 2006 to 2007?
A. 0%
B. 25%
C. 33.33%
D. 66.66%
E. 100%
Attachment:
GRE - The graph below represents a professional football league's total .jpg [ 96.93 KiB | Viewed 3799 times ]
By what percent did the total number of defensive scouts increase from 2006 to 2007?
A. 0%
B. 25%
C. 33.33%
D. 66.66%
E. 100%
Re: The graph below represents a professional football league's
[#permalink]
 15 Dec 2018, 19:59
Carcass wrote:
The graph below represents a professional football league's total scouting make up for all teams. The top graph shows the total number of scouts working for the league in the categories of Offensive and Defensive players. The second graph illustrates their total compensation in thousands of dollars.
By what percent did the total number of defensive scouts increase from 2006 to 2007?
A. 0%
B. 25%
C. 33.33%
D. 66.66%
E. 100%
Attachment:
GRE - The graph below represents a professional football league's total .jpg
By what percent did the total number of defensive scouts increase from 2006 to 2007?
A. 0%
B. 25%
C. 33.33%
D. 66.66%
E. 100%
As usual in data interpretation problems, break up each part of the sentence and then the solution will usually come (not that this problem is difficult or anything, but that will help you in harder problems).
First, look only at the top graph, the bottom graph is irrelevant. Then, find out the number of defensive scouts (DS) in 2006.
# ds 2006: 75
# ds 2007: 100
To get percent increase, always start with bigger number, to get percent decrease, always start with smaller number. Then, you always divide by the second number.
percent increase = (100-75)/75 = 33.33%
Moderators:


