GRE Prep Club Daily Prep
Thank you for using the timer - this advanced tool can estimate your performance and suggest more practice questions. We have subscribed you to Daily Prep Questions via email.
Customized
for You
Track
Your Progress
Practice
Pays
Not interested in getting valuable practice questions and articles delivered to your email? No problem, unsubscribe here.
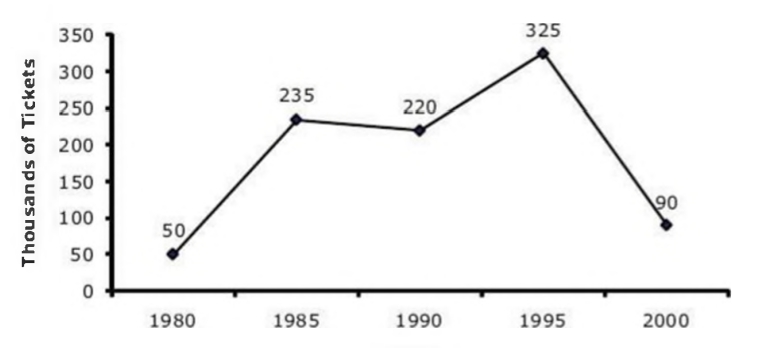
Average Daily Full-Price Ticket Sales for Aquarium A
[#permalink]
 20 Oct 2017, 16:32
Expert Reply
Question Stats:
 93% (04:37) correct
 6% (05:07) wrong
  based on 15 sessions
Hide Show timer Statistics
Average Daily Full-Price Ticket Sales for Aquarium A

#GREpracticequestion In how many years shown was the average duration of visits to Aquarium A.jpg [ 46.57 KiB | Viewed 8577 times ]
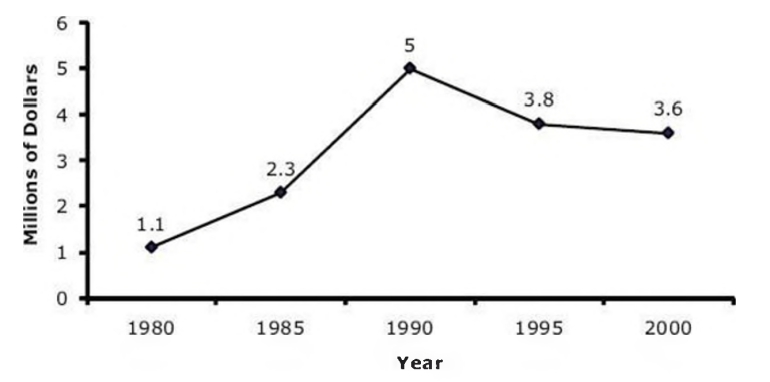
Total Yearly Gift Shop Revenue for Aquarium A

#GREpracticequestion In 1980, if a full-price ticket cost $4.70.jpg [ 44.89 KiB | Viewed 8554 times ]
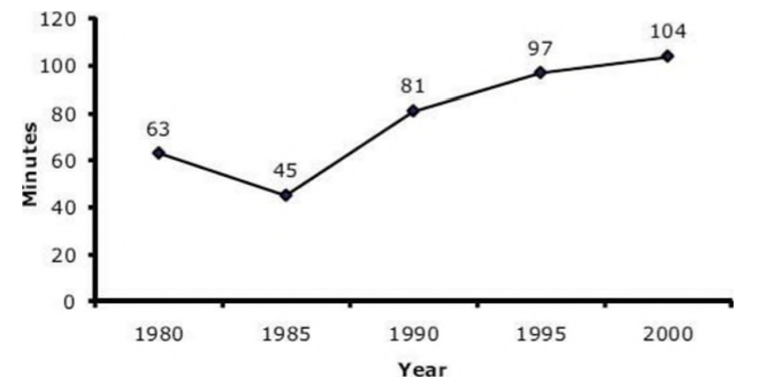
Average Duration of Visits to Aquarium A

#GREpracticequestion In 2000, the total number of dollars of gift shop revenue .jpg [ 44.11 KiB | Viewed 8596 times ]
Attachment:
#GREpracticequestion In how many years shown was the average duration of visits to Aquarium A.jpg [ 46.57 KiB | Viewed 8577 times ]
Total Yearly Gift Shop Revenue for Aquarium A
Attachment:
#GREpracticequestion In 1980, if a full-price ticket cost $4.70.jpg [ 44.89 KiB | Viewed 8554 times ]
Average Duration of Visits to Aquarium A
Attachment:
#GREpracticequestion In 2000, the total number of dollars of gift shop revenue .jpg [ 44.11 KiB | Viewed 8596 times ]
In how many years shown was the average duration of visits to Aquarium A more than twice as much as the average in 1985?
(A) Four
(B) Three
(C) Two
(D) One
(E) None
In 1980, if a full-price ticket cost $4.70, what would have been the average daily revenue, in thousands of dollars, from the sale of full-price tickets?
enter your value
In 2000, the total number of dollars of gift shop revenue was how many times as great as the average daily number of full-price tickets sold?
(A) 400
(B) 200
(C) 80
(D) 40
(E) 20
What was the approximate percent increase in average daily full-price ticket sales from 1990 to 1995?
(A) 10 %
(B) 20 %
(C) 33%
(D) 48%
(E) 66%
Which of the following statements can be inferred from the data?
□ In each of the 5-year periods shown in which yearly gift shop revenue decreased, average daily full-price ticket sales also decreased.
□ The greatest increase in total yearly gift shop revenue over any 5-year period shown was $ 2.7 million.
□ From 1995 to 2000, the average duration of visits to the museum increased by 12 minutes.
(A) Four
(B) Three
(C) Two
(D) One
(E) None
Show: :: OA
C
In 1980, if a full-price ticket cost $4.70, what would have been the average daily revenue, in thousands of dollars, from the sale of full-price tickets?
enter your value
Show: :: OA
235
In 2000, the total number of dollars of gift shop revenue was how many times as great as the average daily number of full-price tickets sold?
(A) 400
(B) 200
(C) 80
(D) 40
(E) 20
Show: :: OA
D
What was the approximate percent increase in average daily full-price ticket sales from 1990 to 1995?
(A) 10 %
(B) 20 %
(C) 33%
(D) 48%
(E) 66%
Show: :: OA
D
Which of the following statements can be inferred from the data?
□ In each of the 5-year periods shown in which yearly gift shop revenue decreased, average daily full-price ticket sales also decreased.
□ The greatest increase in total yearly gift shop revenue over any 5-year period shown was $ 2.7 million.
□ From 1995 to 2000, the average duration of visits to the museum increased by 12 minutes.
Show: :: OA
II only
Re: Average Daily Full-Price Ticket Sales for Aquarium A
[#permalink]
 06 Nov 2017, 08:00
Solution to
Quote:
"In 1980, if a full-price ticket cost $4.70, what would have been the average daily revenue, in thousands of dollars, from the sale of full-price tickets?"
please.
Re: Average Daily Full-Price Ticket Sales for Aquarium A
[#permalink]
 06 Nov 2017, 08:58
2
ebjose wrote:
Solution to
Quote:
"In 1980, if a full-price ticket cost $4.70, what would have been the average daily revenue, in thousands of dollars, from the sale of full-price tickets?"
please.The third graph shows the daily average of ticket sold for each year in analysis. Then, you just have to take the number of tickets sold on average in 1980 (50,000) and multiply it by the average price of the ticket (4.70$), this gives you 50,000*4.70 = 235,000 or 235 thousand.
Hope it is clear now


