GRE Prep Club Daily Prep
Thank you for using the timer - this advanced tool can estimate your performance and suggest more practice questions. We have subscribed you to Daily Prep Questions via email.
Customized
for You
Track
Your Progress
Practice
Pays
Not interested in getting valuable practice questions and articles delivered to your email? No problem, unsubscribe here.
Which of the following can be inferred from the graphs? Choose all
[#permalink]
 23 Feb 2022, 05:00
Expert Reply
2
Bookmarks
Question Stats:
 33% (01:58) correct
 66% (02:42) wrong
  based on 21 sessions
Hide Show timer Statistics
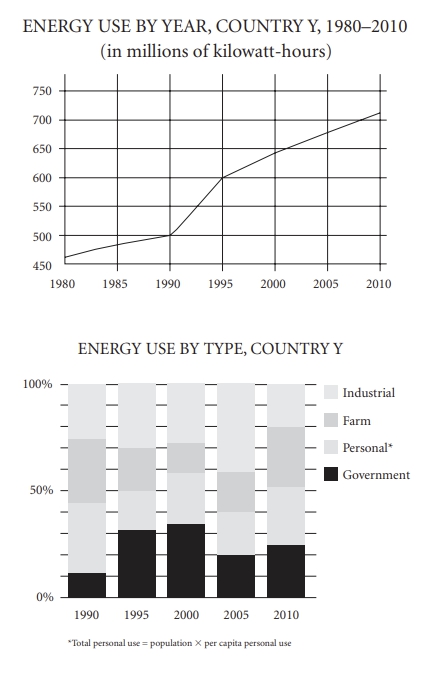
Which of the following can be inferred from the graphs?
Choose all that apply.
A Farm use of energy increased between 1990 and 2010.
B In 2010, industrial use of energy was greater than industrial use of energy in 1995.
C The percentage of energy use by government in 2010 was at least three times the percentage of energy use by government in 1990.
D More kilowatt-hours of energy were used for farm purposes in 2005 than in 2000.
E The energy usage by type was most equally distributed over the four categories in 1990.
Re: Which of the following can be inferred from the graphs? Choose all
[#permalink]
 01 Mar 2022, 03:00
Expert Reply
Re: Which of the following can be inferred from the graphs? Choose all
[#permalink]
 01 Mar 2022, 10:03
1
Carcass wrote:
Which of the following can be inferred from the graphs?
Choose all that apply.
A Farm use of energy increased between 1990 and 2010.
B In 2010, industrial use of energy was greater than industrial use of energy in 1995.
C The percentage of energy use by government in 2010 was at least three times the percentage of energy use by government in 1990.
D More kilowatt-hours of energy were used for farm purposes in 2005 than in 2000.
E The energy usage by type was most equally distributed over the four categories in 1990.

Choose all that apply.
A Farm use of energy increased between 1990 and 2010.
B In 2010, industrial use of energy was greater than industrial use of energy in 1995.
C The percentage of energy use by government in 2010 was at least three times the percentage of energy use by government in 1990.
D More kilowatt-hours of energy were used for farm purposes in 2005 than in 2000.
E The energy usage by type was most equally distributed over the four categories in 1990.
Lets take each case one by one
A Farm use of energy increased between 1990 and 2010. Correct, all energy consumption increased from 1990 to 2010 and also energy used by farm is typically in same range
B In 2010, industrial use of energy was greater than industrial use of energy in 1995. Incorrect, can't be inferred from both graphs
C The percentage of energy use by government in 2010 was at least three times the percentage of energy use by government in 1990. Incorrect, can't be inferred from both graphs
D More kilowatt-hours of energy were used for farm purposes in 2005 than in 2000. Correct, this can be inferred from 1st graph
E The energy usage by type was most equally distributed over the four categories in 1990. Incorrect, can't be inferred from both graphs


