GRE Prep Club Daily Prep
Thank you for using the timer - this advanced tool can estimate your performance and suggest more practice questions. We have subscribed you to Daily Prep Questions via email.
Customized
for You
Track
Your Progress
Practice
Pays
Not interested in getting valuable practice questions and articles delivered to your email? No problem, unsubscribe here.
A marketing class of a college has a total strength of 30. The class f
[#permalink]
 05 Jan 2024, 01:04
Expert Reply
Question Stats:
 50% (01:09) correct
 50% (02:21) wrong
  based on 6 sessions
Hide Show timer Statistics
A marketing class of a college has a total strength of 30. The class formed three groups: G1, G2, and G3, which have 10, 10, and 6 students, respectively. If no student of G1 is in either of the other two groups, what is the greatest possible number of students who are in none of the groups?
(A) 6
(B) 7
(C) 8
(D) 10
(E) 14
(A) 6
(B) 7
(C) 8
(D) 10
(E) 14
Part of the project: The Butler-GRE Daily New Quant and Verbal Questions to Practice (2023) - Gain 20 Kudos & Get FREE Access to GRE Prep Club TESTS
~~~~~~~~~~~~~~~~~~~~~~~~~~~~~~~~~~~~~~~~
Free Materials for the GRE General Exam - Where to get it!!
GRE Geometry Formulas
GRE - Math Book
~~~~~~~~~~~~~~~~~~~~~~~~~~~~~~~~~~~~~~~~
Free Materials for the GRE General Exam - Where to get it!!
GRE Geometry Formulas
GRE - Math Book
Manager

Joined: 11 Nov 2023
Posts: 228
Given Kudos: 78
WE:Business Development (Advertising and PR)
Re: A marketing class of a college has a total strength of 30. The class f
[#permalink]
 19 Jan 2024, 14:17
1
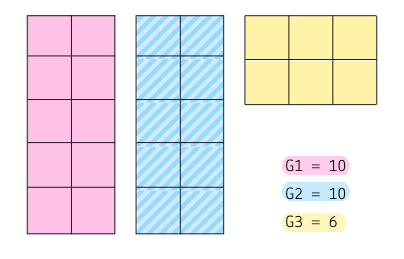
Rather than the standard Venn Diagram, I thought it might be interesting to visualize the overlapping groups using blocks.
We're given that G1 = 10, G2 = 10, G3 = 6. Let x = the # of students who are in none of the groups.
Say a = only in G1, b = in only G1+G2, c = only in G2, d = only in G1+G3, e = students in all three, f = only in G2+G3, g = only in G3.
G1 = a + b + d + e
G2 = b + c + e + f
G3 = d + e + f + g
x = 30 - (G1+G2+G3-b-d-2e-f)
Since "no student of G1 is in either of the other two groups", this means b, d, and e = 0.
Thus, a = 10 and x = 30 - (G1+G2+G3-f)
Now, let's consider what happens when the overlap between G2+G3, or f, varies, and how it affects x.
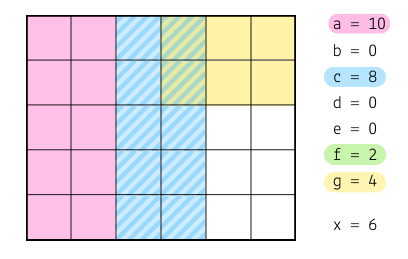
In the above, the blocks are arranged such that G1 does not overlap with the other two, and G2+G3 overlap by 2. Thus, f = 2.
If f = 2, then x = 30 - (10+10+6-2) = 6
However, we can see that in order to maximize x, we can fully overlap G3 over G2, such that f = 6.
If f = 6, then x = 30 - (10+4+6) = 10
Attachment:
File comment: G1, G2, and G3 represented as blocks

overlapping_blocks.png [ 20.18 KiB | Viewed 1166 times ]
overlapping_blocks.png [ 20.18 KiB | Viewed 1166 times ]
We're given that G1 = 10, G2 = 10, G3 = 6. Let x = the # of students who are in none of the groups.
Say a = only in G1, b = in only G1+G2, c = only in G2, d = only in G1+G3, e = students in all three, f = only in G2+G3, g = only in G3.
G1 = a + b + d + e
G2 = b + c + e + f
G3 = d + e + f + g
x = 30 - (G1+G2+G3-b-d-2e-f)
Since "no student of G1 is in either of the other two groups", this means b, d, and e = 0.
Thus, a = 10 and x = 30 - (G1+G2+G3-f)
Now, let's consider what happens when the overlap between G2+G3, or f, varies, and how it affects x.
Attachment:
File comment: Blocks overlapped so that x = 6

overlap_x6.png [ 21.72 KiB | Viewed 1190 times ]
overlap_x6.png [ 21.72 KiB | Viewed 1190 times ]
In the above, the blocks are arranged such that G1 does not overlap with the other two, and G2+G3 overlap by 2. Thus, f = 2.
If f = 2, then x = 30 - (10+10+6-2) = 6
Attachment:
File comment: Blocks overlapped so that x = 10

overlapping_x10.png [ 22.54 KiB | Viewed 1177 times ]
overlapping_x10.png [ 22.54 KiB | Viewed 1177 times ]
However, we can see that in order to maximize x, we can fully overlap G3 over G2, such that f = 6.
If f = 6, then x = 30 - (10+4+6) = 10

gmatclubot
Re: A marketing class of a college has a total strength of 30. The class f [#permalink]
19 Jan 2024, 14:17
Moderators:


