
GRE Prep Club Daily Prep
Thank you for using the timer - this advanced tool can estimate your performance and suggest more practice questions. We have subscribed you to Daily Prep Questions via email.
Customized
for You
Track
Your Progress
Practice
Pays
Not interested in getting valuable practice questions and articles delivered to your email? No problem, unsubscribe here.
For which of the following industries
[#permalink]
 15 Jul 2021, 09:45
Expert Reply

00:00
Question Stats:
 53% (01:35) correct
46% (01:05) wrong based on 13 sessions
53% (01:35) correct
46% (01:05) wrong based on 13 sessions
Hide Show timer Statistics
INDUSTRIAL WASTE GENERATED BY SPECIFIC INDUSTRIES OF COUNTRY X
Note: Because of the great disparity in the amounts of waste generated by different industries, the graph is broken in three places, and after each break, a new and more appropriate scale is introduced. As usual, the value represented by a bar is read only at its far right end.
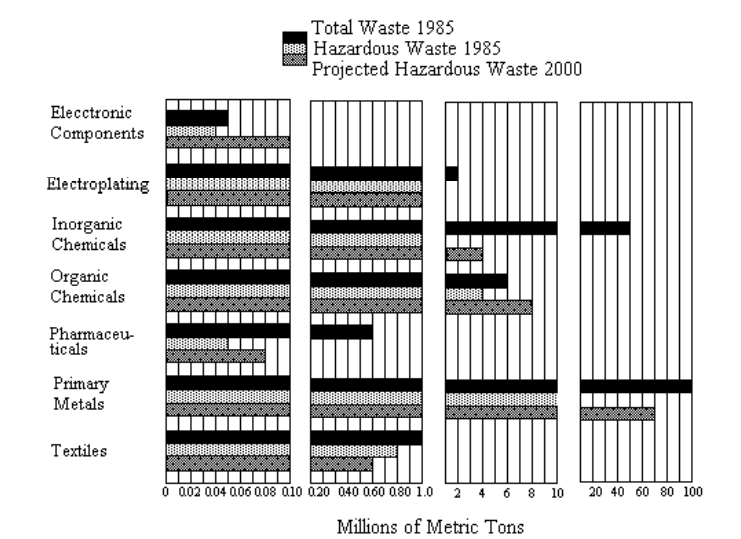
For which of the following industries is the hazardous waste projection for the year 2000 at least double its 1985 level?
I. Electronic components
II. Electroplating
III. Inorganic chemicals
(A) I only
(B) I and II only
(C) I and III only
(D) II and III only
(E) I, II, and III
Note: Because of the great disparity in the amounts of waste generated by different industries, the graph is broken in three places, and after each break, a new and more appropriate scale is introduced. As usual, the value represented by a bar is read only at its far right end.
For which of the following industries is the hazardous waste projection for the year 2000 at least double its 1985 level?
I. Electronic components
II. Electroplating
III. Inorganic chemicals
(A) I only
(B) I and II only
(C) I and III only
(D) II and III only
(E) I, II, and III
Retired Moderator
Joined: 16 Apr 2020
Status:Founder & Quant Trainer
Affiliations: Prepster Education
Posts: 1546
Given Kudos: 172
Location: India
WE:Education (Education)
Re: For which of the following industries
[#permalink]
18 Jul 2021, 00:33
1
Carcass wrote:
INDUSTRIAL WASTE GENERATED BY SPECIFIC INDUSTRIES OF COUNTRY X
Note: Because of the great disparity in the amounts of waste generated by different industries, the graph is broken in three places, and after each break, a new and more appropriate scale is introduced. As usual, the value represented by a bar is read only at its far right end.
For which of the following industries is the hazardous waste projection for the year 2000 at least double its 1985 level?
I. Electronic components
II. Electroplating
III. Inorganic chemicals
(A) I only
(B) I and II only
(C) I and III only
(D) II and III only
(E) I, II, and III
The ratio of Projected waste to Hazardous waste should be greater than or equal to 2 : 1
I. Electronic components
Hazardous waste = 0.04 MMT
Projected waste = 0.10 MMT
Ratio = 5 : 2
II. Electroplating
Hazardous waste = 1 MMT
Projected waste = 1 MMT
Ratio = 1 : 1
III. Inorganic chemicals
Hazardous waste = 1 MMT
Projected waste = 4 MMT
Ratio = 4 : 1
Hence, option C
Moderators:
