GRE Prep Club Daily Prep
Thank you for using the timer - this advanced tool can estimate your performance and suggest more practice questions. We have subscribed you to Daily Prep Questions via email.
Customized
for You
Track
Your Progress
Practice
Pays
Not interested in getting valuable practice questions and articles delivered to your email? No problem, unsubscribe here.
Important Trends and Information from the GRE % Growth Data
[#permalink]
 06 Jun 2025, 09:26
Expert Reply
Important Trends and Information from the GRE % Growth Data:
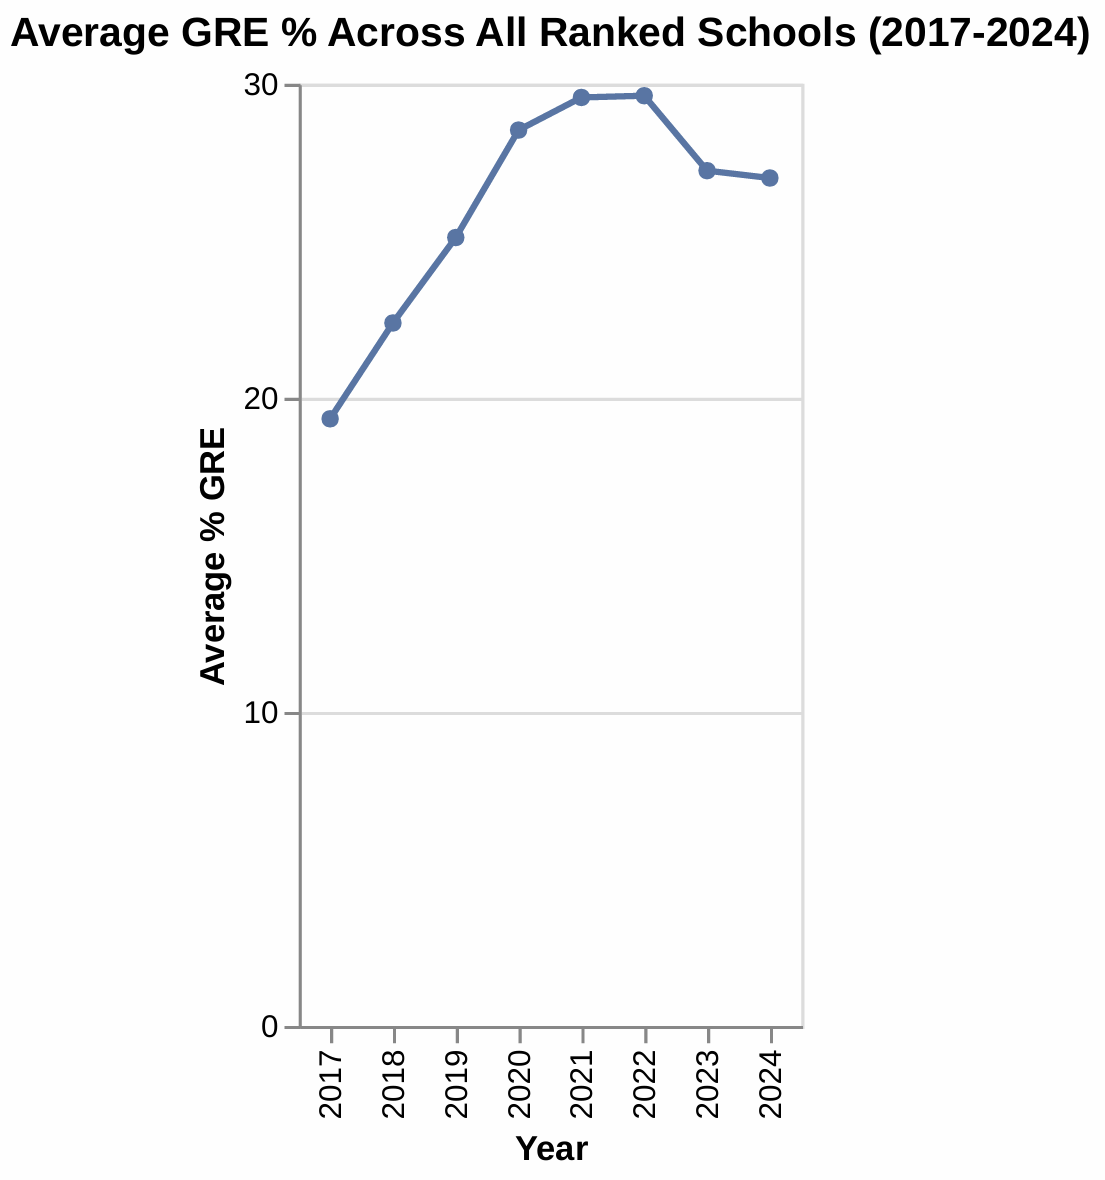
1. Overall GRE Adoption Trends (Average \% GRE Across All Schools):
The average GRE percentage across all ranked schools shows fluctuations but generally indicates a growing acceptance of GRE scores over time. In 2017, the average was around 19\%, rising to about $27 \%$ in 2024. This suggests a broader shift towards accepting GRE scores in MBA admissions.

GRE 1.png [ 56.44 KiB | Viewed 888 times ]
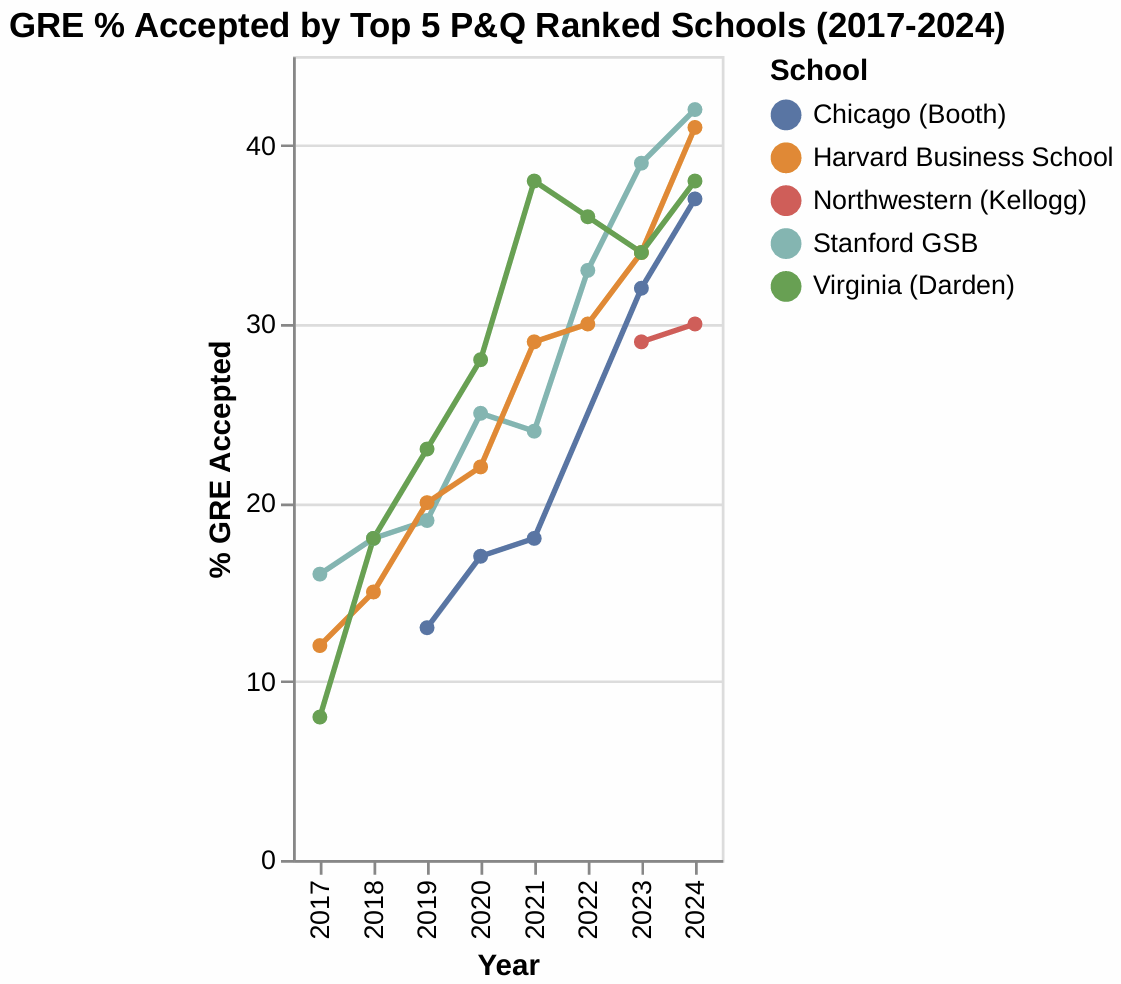
2. Trends Among Top-Ranked Schools :
Top-ranked schools generally show an increasing trend in the percentage of admitted students submitting GRE scores, indicating a broader acceptance or even preference for GRE alongside GMAT over time. For instance:
- Stanford GSB: Increased from $16 \%$ (in 2017) to $42 \%$ (in 2024).
- Chicago (Booth): Increased from $13 \%$ (in 2019) to $37 \%$ (in 2024).
- Harvard Business School: Increased from $12 \%$ (in 2017) to $41 \%$ (in 2024).
- Virginia (Darden): Increased from $8 \%$ (in 2017) to $38 \%$ (in 2024).
This consistent growth among top schools signifies a broader trend in MBA admissions.

GRE 2.png [ 100.41 KiB | Viewed 897 times ]
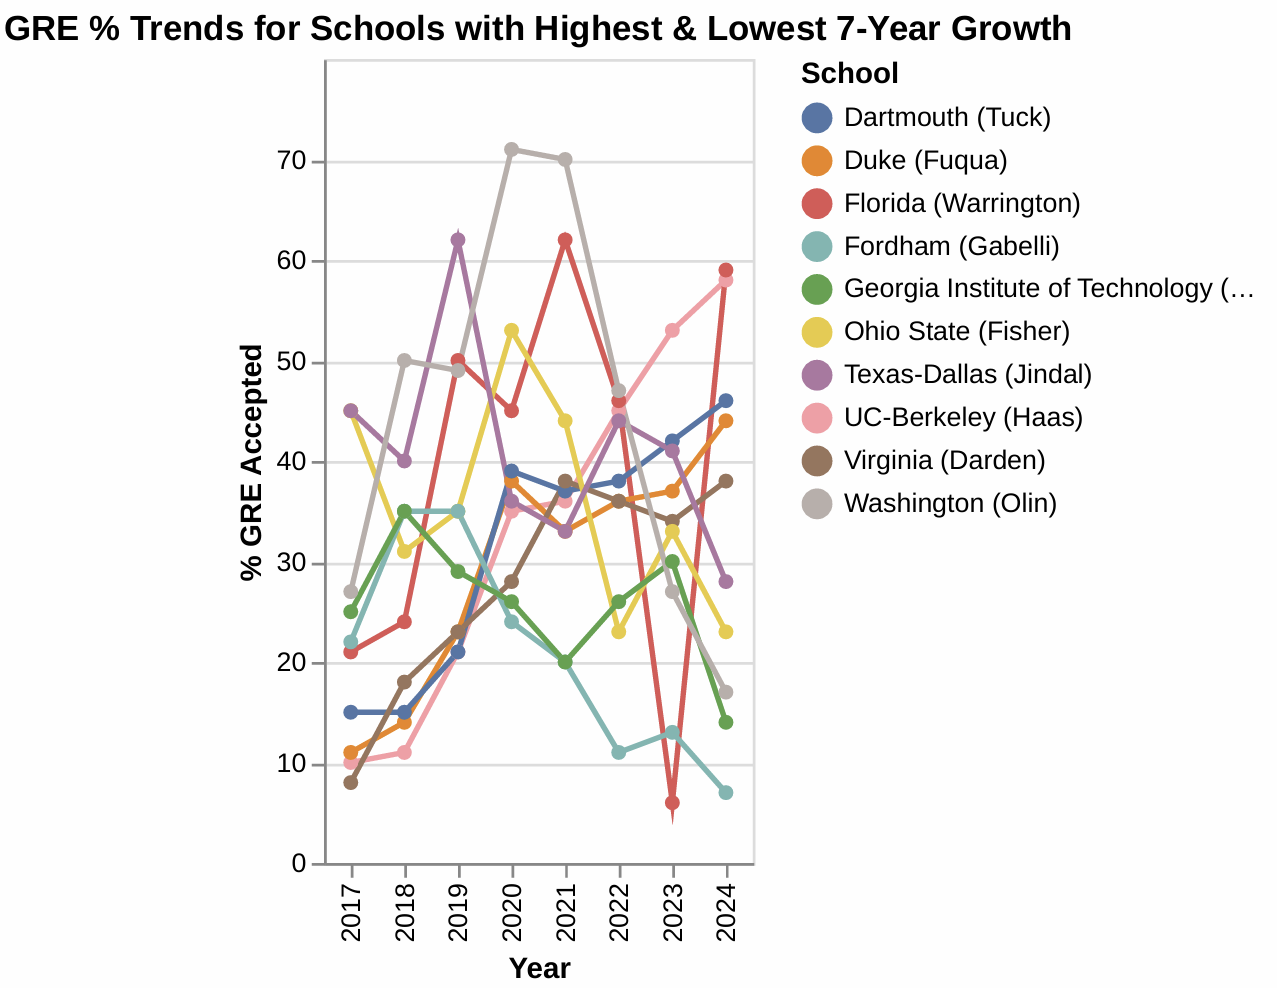
3. Schools with Notable 7-Year Trends:
Highest 7-Year Growth:
- UC-Berkeley (Haas): Achieved a remarkable $+48 \%$ increase in GRE acceptance over 7 years. This indicates a strong and sustained focus on expanding GRE admissions or attracting a different pool of applicants.
- Florida (Warrington): Achieved a remarkable +38\% increase in GRE acceptance over 7 years. This indicates a strong and sustained focus on expanding GRE admissions or attracting a different pool of applicants.
- Duke (Fuqua): Achieved a remarkable $+33 \%$ increase in GRE acceptance over 7 years. This indicates a strong and sustained focus on expanding GRE admissions or attracting a different pool of applicants.
- Dartmouth (Tuck): Achieved a remarkable $+31 \%$ increase in GRE acceptance over 7 years. This indicates a strong and sustained focus on expanding GRE admissions or attracting a different pool of applicants.
- Virginia (Darden): Achieved a remarkable $+30 \%$ increase in GRE acceptance over 7 years. This indicates a strong and sustained focus on expanding GRE admissions or attracting a different pool of applicants.
Lowest 7-Year Growth (or decline):
- Ohio State (Fisher): Experienced a $-22 \%$ change in GRE acceptance over 7 years.
- Texas-Dallas (Jindal): Experienced a $-17 \%$ change in GRE acceptance over 7 years.
- Fordham (Gabelli): Experienced a $-15 \%$ change in GRE acceptance over 7 years.
- Georgia Institute of Technology (Scheller): Experienced a -11\% change in GRE acceptance over 7 years.
- Washington (Olin): Experienced a $-10 \%$ change in GRE acceptance over 7 years.
This highlights varying strategies among schools regarding GRE scores, with some increasing their acceptance significantly while others have seen a decline or stagnation.

GRE 3.png [ 188.5 KiB | Viewed 888 times ]
4. Volatility in Trends:
Some schools show significant year-over-year fluctuations, indicating less stable policies or varying applicant pools. A prime example is:
- Florida (Warrington): Exhibited highly erratic trends, for instance, a sharp rise from $6 \%$ in 2023 to $59 \%$ in 2024, after a significant drop from 62\% in 2021 to 6\% in 2023. This points to highly volatile trends.
5. Data Completeness:
It's important to note the presence of missing data ('NA' or 'N/A' values) for several schools, especially in earlier years. This indicates that not all schools reported GRE percentages for all years, or they might have only started accepting GRE scores more recently. This incompleteness can affect the comprehensiveness of the 7-year trend analysis for some institutions.
Based on the "Average GRE % Across All Ranked Schools (2017-2024)" data, here are the key takeaways:
- Steady Increase (2017-2022): The average GRE percentage showed a consistent upward trend from $19.3 \%$ in 2017, peaking at approximately $29.6 \%$ in 2022. This indicates a growing emphasis or presence of GRE scores in admissions criteria or a higher submission rate during this period.
- Recent Plateau/Slight Dip (2022-2024): After reaching its highest point in 2022, the average GRE percentage appears to have plateaued or experienced a slight decline, settling around $27.0 \%$ by 2024. This suggests a potential shift, possibly indicating a stabilization or a slight decrease in the importance or requirement of GRE scores in the most recent years.
- Overall Growth: Despite the recent stabilization, the average GRE percentage in 2024 (27.0\%) remains significantly higher than in 2017 (19.3\%), reflecting an overall increase in the prevalence or significance of GRE scores over this seven-year period.
1. Overall GRE Adoption Trends (Average \% GRE Across All Schools):
The average GRE percentage across all ranked schools shows fluctuations but generally indicates a growing acceptance of GRE scores over time. In 2017, the average was around 19\%, rising to about $27 \%$ in 2024. This suggests a broader shift towards accepting GRE scores in MBA admissions.
Attachment:
GRE 1.png [ 56.44 KiB | Viewed 888 times ]
2. Trends Among Top-Ranked Schools :
Top-ranked schools generally show an increasing trend in the percentage of admitted students submitting GRE scores, indicating a broader acceptance or even preference for GRE alongside GMAT over time. For instance:
- Stanford GSB: Increased from $16 \%$ (in 2017) to $42 \%$ (in 2024).
- Chicago (Booth): Increased from $13 \%$ (in 2019) to $37 \%$ (in 2024).
- Harvard Business School: Increased from $12 \%$ (in 2017) to $41 \%$ (in 2024).
- Virginia (Darden): Increased from $8 \%$ (in 2017) to $38 \%$ (in 2024).
This consistent growth among top schools signifies a broader trend in MBA admissions.
Attachment:
GRE 2.png [ 100.41 KiB | Viewed 897 times ]
3. Schools with Notable 7-Year Trends:
Highest 7-Year Growth:
- UC-Berkeley (Haas): Achieved a remarkable $+48 \%$ increase in GRE acceptance over 7 years. This indicates a strong and sustained focus on expanding GRE admissions or attracting a different pool of applicants.
- Florida (Warrington): Achieved a remarkable +38\% increase in GRE acceptance over 7 years. This indicates a strong and sustained focus on expanding GRE admissions or attracting a different pool of applicants.
- Duke (Fuqua): Achieved a remarkable $+33 \%$ increase in GRE acceptance over 7 years. This indicates a strong and sustained focus on expanding GRE admissions or attracting a different pool of applicants.
- Dartmouth (Tuck): Achieved a remarkable $+31 \%$ increase in GRE acceptance over 7 years. This indicates a strong and sustained focus on expanding GRE admissions or attracting a different pool of applicants.
- Virginia (Darden): Achieved a remarkable $+30 \%$ increase in GRE acceptance over 7 years. This indicates a strong and sustained focus on expanding GRE admissions or attracting a different pool of applicants.
Lowest 7-Year Growth (or decline):
- Ohio State (Fisher): Experienced a $-22 \%$ change in GRE acceptance over 7 years.
- Texas-Dallas (Jindal): Experienced a $-17 \%$ change in GRE acceptance over 7 years.
- Fordham (Gabelli): Experienced a $-15 \%$ change in GRE acceptance over 7 years.
- Georgia Institute of Technology (Scheller): Experienced a -11\% change in GRE acceptance over 7 years.
- Washington (Olin): Experienced a $-10 \%$ change in GRE acceptance over 7 years.
This highlights varying strategies among schools regarding GRE scores, with some increasing their acceptance significantly while others have seen a decline or stagnation.
Attachment:
GRE 3.png [ 188.5 KiB | Viewed 888 times ]
4. Volatility in Trends:
Some schools show significant year-over-year fluctuations, indicating less stable policies or varying applicant pools. A prime example is:
- Florida (Warrington): Exhibited highly erratic trends, for instance, a sharp rise from $6 \%$ in 2023 to $59 \%$ in 2024, after a significant drop from 62\% in 2021 to 6\% in 2023. This points to highly volatile trends.
5. Data Completeness:
It's important to note the presence of missing data ('NA' or 'N/A' values) for several schools, especially in earlier years. This indicates that not all schools reported GRE percentages for all years, or they might have only started accepting GRE scores more recently. This incompleteness can affect the comprehensiveness of the 7-year trend analysis for some institutions.
Based on the "Average GRE % Across All Ranked Schools (2017-2024)" data, here are the key takeaways:
- Steady Increase (2017-2022): The average GRE percentage showed a consistent upward trend from $19.3 \%$ in 2017, peaking at approximately $29.6 \%$ in 2022. This indicates a growing emphasis or presence of GRE scores in admissions criteria or a higher submission rate during this period.
- Recent Plateau/Slight Dip (2022-2024): After reaching its highest point in 2022, the average GRE percentage appears to have plateaued or experienced a slight decline, settling around $27.0 \%$ by 2024. This suggests a potential shift, possibly indicating a stabilization or a slight decrease in the importance or requirement of GRE scores in the most recent years.
- Overall Growth: Despite the recent stabilization, the average GRE percentage in 2024 (27.0\%) remains significantly higher than in 2017 (19.3\%), reflecting an overall increase in the prevalence or significance of GRE scores over this seven-year period.

gmatclubot
Important Trends and Information from the GRE % Growth Data [#permalink]
06 Jun 2025, 09:26
Moderators:
|
|
||

