GRE Prep Club Daily Prep
Thank you for using the timer - this advanced tool can estimate your performance and suggest more practice questions. We have subscribed you to Daily Prep Questions via email.
Customized
for You
Track
Your Progress
Practice
Pays
Not interested in getting valuable practice questions and articles delivered to your email? No problem, unsubscribe here.
The salary scale for players in a certain sports league is d
[#permalink]
 Updated on: 14 Jul 2018, 11:19
1
1
Bookmarks
Question Stats:
 85% (01:24) correct
 14% (02:03) wrong
  based on 42 sessions
Hide Show timer Statistics
The salary scale for players in a certain sports league is determined statistically by reference to a curve with a normal distribution. In 1960, the mean salary for players in the league was $10,000 with a standard deviation of $1000. That year,rookie players were paid $8,000. In 2010, the mean salary for players in the league was 1,175,000 with a standard deviation of $300,000. Rookies in 2010 were paid salaries in a dollar amount equal to a position on normal curve for 2010 that rookie players were paid in the year 1960. What was the salary for rookie players in 2010?
A- $1,475,000
B- $1,175,000
C- $875,000
D- $575,000
E- $275,000
Cambridge, Victory book.
A- $1,475,000
B- $1,175,000
C- $875,000
D- $575,000
E- $275,000
Cambridge, Victory book.
Re: Standard Deviation Question
[#permalink]
 14 Jul 2018, 11:16
Expert Reply
Is this a numeric entry question or a problem solving with five answer choices ??
Please post the question properly, so we can help you @Menna.
Regards
Please post the question properly, so we can help you @Menna.
Regards
Re: The salary scale for players in a certain sports league is d
[#permalink]
 15 Jul 2018, 02:35
2
Expert Reply
The trick in this question is not to get intimidated by the terms mean and standard deviation.
Mean is the salary the guy at 50th percentile gets. So let us suppose we have 100 guys in the league and we make them stand in a row with increasing salary then the guy standing in the 50th position in the line get the mean salary.
So 50th guy in the line will get $10000 in 1960
So 50th guy in the line will get $1175000 in 2010.
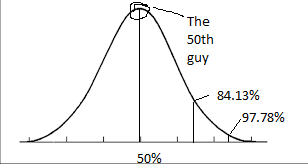
Look at the curve below. One standard deviation means that the guys at 84.13 (50% +34.13%) earn more and and guys at 15.87% (50% - 34.13%) earn less by the amount of standard deviation.

bell curve.png [ 7.13 KiB | Viewed 3945 times ]
So in 1960 the guys earning $10000 were at 50% guys earning $9000 ($10000-$1000) were at the 15.87% and guys earning $8000 ($10000-2*$1000) were at 2.28%.
The question suggest the all the rookie players were in the last 2.28% of the population.
So apply the distribution to the new salaries we can say that rookies in 2010 were earning two standard deviations below the average.
So the rookie income in 2010 = mean income - 2 *standard devation= $1175000-$300000-$300000.=$575000
Mean is the salary the guy at 50th percentile gets. So let us suppose we have 100 guys in the league and we make them stand in a row with increasing salary then the guy standing in the 50th position in the line get the mean salary.
So 50th guy in the line will get $10000 in 1960
So 50th guy in the line will get $1175000 in 2010.
Look at the curve below. One standard deviation means that the guys at 84.13 (50% +34.13%) earn more and and guys at 15.87% (50% - 34.13%) earn less by the amount of standard deviation.
Attachment:
bell curve.png [ 7.13 KiB | Viewed 3945 times ]
So in 1960 the guys earning $10000 were at 50% guys earning $9000 ($10000-$1000) were at the 15.87% and guys earning $8000 ($10000-2*$1000) were at 2.28%.
The question suggest the all the rookie players were in the last 2.28% of the population.
So apply the distribution to the new salaries we can say that rookies in 2010 were earning two standard deviations below the average.
So the rookie income in 2010 = mean income - 2 *standard devation= $1175000-$300000-$300000.=$575000


