GRE Prep Club Daily Prep
Thank you for using the timer - this advanced tool can estimate your performance and suggest more practice questions. We have subscribed you to Daily Prep Questions via email.
Customized
for You
Track
Your Progress
Practice
Pays
Not interested in getting valuable practice questions and articles delivered to your email? No problem, unsubscribe here.
The graph below shows the body mass index (BMI) and basal me
[#permalink]
 02 Dec 2018, 03:15
Expert Reply
2
Bookmarks
Question Stats:
 100% (01:01) correct
 0% (00:00) wrong
  based on 47 sessions
Hide Show timer Statistics
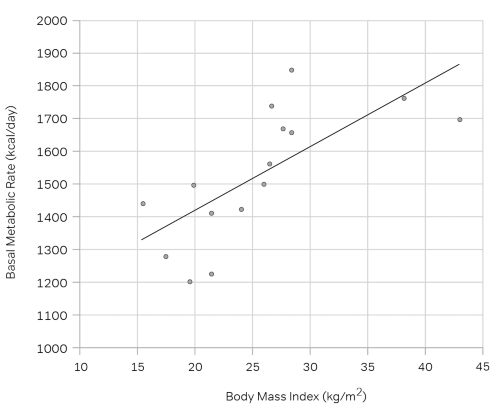
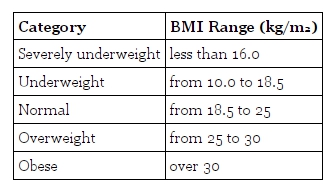
The graph below shows the body mass index (BMI) and basal metabolic rate (BMR) of fifteen males between the ages of 43 and 65.

GRE exam - The graph below shows the body mass index (BMI) and basal me.jpg [ 47.73 KiB | Viewed 10237 times ]

GRE exam - The graph below shows the body mass index (BMI) and basal me 1.jpg [ 44.45 KiB | Viewed 10253 times ]
The trendline on the graph indicates, for a given BMI, what the expected BMR would be for that individual. In this group, how many individuals have a BMR higher than predicted by this trendline?
Attachment:
GRE exam - The graph below shows the body mass index (BMI) and basal me.jpg [ 47.73 KiB | Viewed 10237 times ]
Attachment:
GRE exam - The graph below shows the body mass index (BMI) and basal me 1.jpg [ 44.45 KiB | Viewed 10253 times ]
The trendline on the graph indicates, for a given BMI, what the expected BMR would be for that individual. In this group, how many individuals have a BMR higher than predicted by this trendline?
Show: :: OA
7
Re: The graph below shows the body mass index (BMI) and basal me
[#permalink]
 21 Apr 2020, 05:11
1
Carcass wrote:
The graph below shows the body mass index (BMI) and basal metabolic rate (BMR) of fifteen males between the ages of 43 and 65.
The trendline on the graph indicates, for a given BMI, what the expected BMR would be for that individual. In this group, how many individuals have a BMR higher than predicted by this trendline?
The trendline on the graph indicates, for a given BMI, what the expected BMR would be for that individual. In this group, how many individuals have a BMR higher than predicted by this trendline?
Show: :: OA
7
Here,
Each dot in the graph represent an individual.
No. of individuals having a BMR higher than predicted trendline = 7
Re: The graph below shows the body mass index (BMI) and basal me
[#permalink]
 10 Jul 2024, 19:01
Hello from the GRE Prep Club BumpBot!
Thanks to another GRE Prep Club member, I have just discovered this valuable topic, yet it had no discussion for over a year. I am now bumping it up - doing my job. I think you may find it valuable (esp those replies with Kudos).
Want to see all other topics I dig out? Follow me (click follow button on profile). You will receive a summary of all topics I bump in your profile area as well as via email.


