GRE Prep Club Daily Prep
Thank you for using the timer - this advanced tool can estimate your performance and suggest more practice questions. We have subscribed you to Daily Prep Questions via email.
Customized
for You
Track
Your Progress
Practice
Pays
Not interested in getting valuable practice questions and articles delivered to your email? No problem, unsubscribe here.
The graph to the right is drawn to scale. If the number of births incr
[#permalink]
 30 Apr 2022, 01:00
Expert Reply
Question Stats:
 70% (01:20) correct
 30% (01:20) wrong
  based on 10 sessions
Hide Show timer Statistics
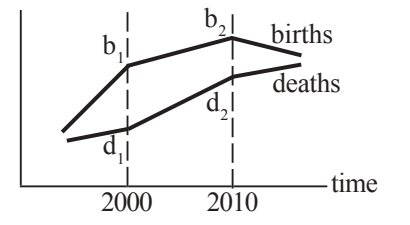
The graph to the right is drawn to scale. If the number of births increased from \(b_1\) to \(b_2\) while the number of deaths increased from \(d_1\) to \(d_2\), what is not true about the change between 2000 and 2010?

screenshot.560.jpg [ 27.24 KiB | Viewed 1642 times ]
(A) The increase in the number of deaths is greater than the increase in the number of births.
(B) The number of births is greater than the number of deaths throughout the entire time period.
(C) The difference in the numbers of births and deaths in 2010 is approximately half of the difference in 2000.
(D) The rates of increase in births and deaths are reflected in the slopes of each line.
(E) All statements are true.
Attachment:
screenshot.560.jpg [ 27.24 KiB | Viewed 1642 times ]
(A) The increase in the number of deaths is greater than the increase in the number of births.
(B) The number of births is greater than the number of deaths throughout the entire time period.
(C) The difference in the numbers of births and deaths in 2010 is approximately half of the difference in 2000.
(D) The rates of increase in births and deaths are reflected in the slopes of each line.
(E) All statements are true.
Part of the project: Skill Builder Project for a Q170
~~~~~~~~~~~~~~~~~~~~~~~~~~~~~~~~~~~~~~~~
GRE Math Essentials for a TOP Quant Score - Q170!!! (2021)
GRE Geometry Formulas for a Q170
GRE - Math Book
~~~~~~~~~~~~~~~~~~~~~~~~~~~~~~~~~~~~~~~~
GRE Math Essentials for a TOP Quant Score - Q170!!! (2021)
GRE Geometry Formulas for a Q170
GRE - Math Book
Re: The graph to the right is drawn to scale. If the number of births incr
[#permalink]
 30 Apr 2022, 03:53
1
Bookmarks
How can we prove statements A & C as right?
Carcass wrote:
The graph to the right is drawn to scale. If the number of births increased from \(b_1\) to \(b_2\) while the number of deaths increased from \(d_1\) to \(d_2\), what is not true about the change between 2000 and 2010?
(A) The increase in the number of deaths is greater than the increase in the number of births.
(B) The number of births is greater than the number of deaths throughout the entire time period.
(C) The difference in the numbers of births and deaths in 2010 is approximately half of the difference in 2000.
(D) The rates of increase in births and deaths are reflected in the slopes of each line.
(E) All statements are true.
Attachment:
screenshot.560.jpg
(A) The increase in the number of deaths is greater than the increase in the number of births.
(B) The number of births is greater than the number of deaths throughout the entire time period.
(C) The difference in the numbers of births and deaths in 2010 is approximately half of the difference in 2000.
(D) The rates of increase in births and deaths are reflected in the slopes of each line.
(E) All statements are true.
Part of the project: Skill Builder Project for a Q170
~~~~~~~~~~~~~~~~~~~~~~~~~~~~~~~~~~~~~~~~
GRE Math Essentials for a TOP Quant Score - Q170!!! (2021)
GRE Geometry Formulas for a Q170
GRE - Math Book
~~~~~~~~~~~~~~~~~~~~~~~~~~~~~~~~~~~~~~~~
GRE Math Essentials for a TOP Quant Score - Q170!!! (2021)
GRE Geometry Formulas for a Q170
GRE - Math Book
Re: The graph to the right is drawn to scale. If the number of births incr
[#permalink]
 30 Apr 2022, 04:45
Expert Reply
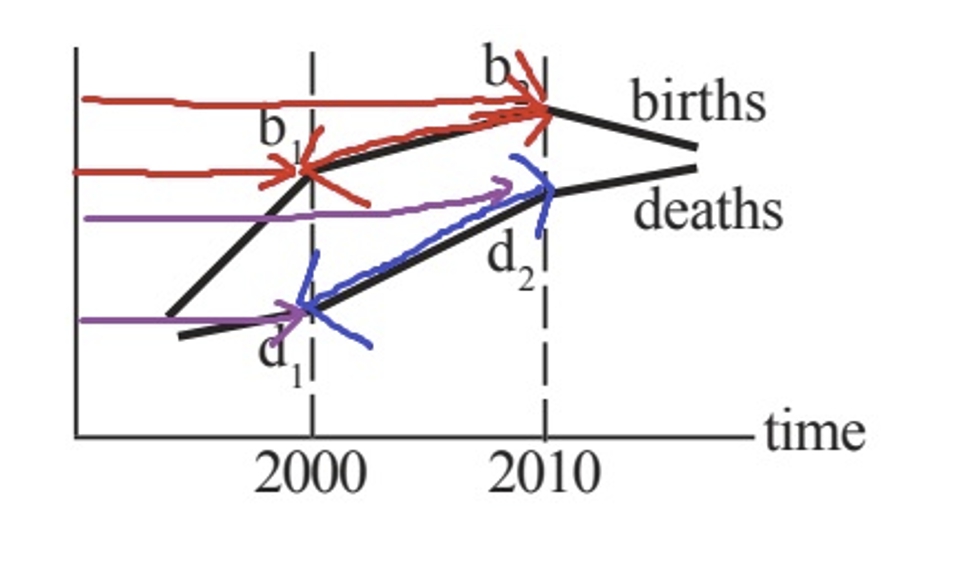
With eyes ball
An estimation.

screenshot.580.jpg [ 106.74 KiB | Viewed 1591 times ]
B is true births > deaths
The line of b is always > of the line of d
C is also true
If you see the arrows the distance b1 and d1 is\( \approx \) half b1d1 for the entire period from 2000 to 2010
Hope this helps
An estimation.
Attachment:
screenshot.580.jpg [ 106.74 KiB | Viewed 1591 times ]
B is true births > deaths
The line of b is always > of the line of d
C is also true
If you see the arrows the distance b1 and d1 is\( \approx \) half b1d1 for the entire period from 2000 to 2010
Hope this helps


