GRE Prep Club Daily Prep
Thank you for using the timer - this advanced tool can estimate your performance and suggest more practice questions. We have subscribed you to Daily Prep Questions via email.
Customized
for You
Track
Your Progress
Practice
Pays
Not interested in getting valuable practice questions and articles delivered to your email? No problem, unsubscribe here.
The divided bar graph to the right shows the breakdown of the yearly c
[#permalink]
 23 Apr 2022, 01:00
Expert Reply
1
Bookmarks
Question Stats:
 12% (00:54) correct
 87% (02:08) wrong
  based on 8 sessions
Hide Show timer Statistics
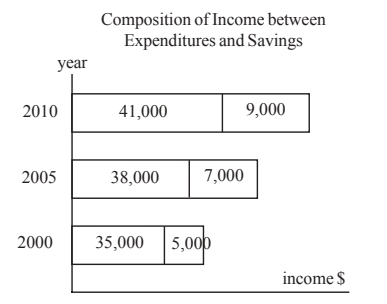
The divided bar graph to the right shows the breakdown of the yearly composition of David's income between his expenditures and savings for three different years. Based on this information, which of the following statements is not true?

GRE Prep Club The divided bar graph to the right shows the breakdown of the yearly .jpg [ 33.83 KiB | Viewed 1877 times ]
(A) There was a greater percent increase in savings than expenditures from the year 2000 to 2010.
(B) The savings/income ratio is the smallest in the year 2000.
(C) The percent increase in savings in the years 2000-2005 is greater than the percent increase in savings in the years 2005-2010.
(D) The increase in income for the years 2000-2005 is the same as in 2005-2010.
(E) All of the statements are true.
Attachment:
GRE Prep Club The divided bar graph to the right shows the breakdown of the yearly .jpg [ 33.83 KiB | Viewed 1877 times ]
(A) There was a greater percent increase in savings than expenditures from the year 2000 to 2010.
(B) The savings/income ratio is the smallest in the year 2000.
(C) The percent increase in savings in the years 2000-2005 is greater than the percent increase in savings in the years 2005-2010.
(D) The increase in income for the years 2000-2005 is the same as in 2005-2010.
(E) All of the statements are true.
Part of the project: Skill Builder Project for a Q170
~~~~~~~~~~~~~~~~~~~~~~~~~~~~~~~~~~~~~~~~
GRE Math Essentials for a TOP Quant Score - Q170!!! (2021)
GRE Geometry Formulas for a Q170
GRE - Math Book
~~~~~~~~~~~~~~~~~~~~~~~~~~~~~~~~~~~~~~~~
GRE Math Essentials for a TOP Quant Score - Q170!!! (2021)
GRE Geometry Formulas for a Q170
GRE - Math Book
Re: The divided bar graph to the right shows the breakdown of the yearly c
[#permalink]
 24 Apr 2022, 10:09
Will wait for OE
Re: The divided bar graph to the right shows the breakdown of the yearly c
[#permalink]
 24 Apr 2022, 10:18
Expert Reply
(A) Savings increased by 80%, from $5,000 to $9,000. True. (B) The savings/income ratio would be $5,000/ $40,000, $7,000/$45,000, and $9,000/$50,000. False. (C) The percent increase in 2000-2005 is $2,000/$5,000, while the percent increase in 2005-2010 is $2,000/$7,000. (D) There is a $2,000 increase in income between both 2000-2005 and 2005-2010.


