GRE Prep Club Daily Prep
Thank you for using the timer - this advanced tool can estimate your performance and suggest more practice questions. We have subscribed you to Daily Prep Questions via email.
Customized
for You
Track
Your Progress
Practice
Pays
Not interested in getting valuable practice questions and articles delivered to your email? No problem, unsubscribe here.
GRE Word Problems
[#permalink]
 09 May 2022, 06:44
Expert Reply
GRE Word Problems - part of the Skill Builder Project
- Set up an equation
- Consecutive Numbers
- Problems about Digit Numbers
- Word problems
- Proportion
- Ratio
- Average
- Percent
- Rate, Time, and Distance
- Mixture Problems
- Venn Diagram
- Word problems with fractions + Miscellaneous
- Practice Questions
Source of the images in this post: A Maths Dictionary for Kids by © Jenny Eather
https://gre.myprepclub.com/forum/an-app ... 28395.html
https://gre.myprepclub.com/forum/if-x-6 ... 28396.html
https://gre.myprepclub.com/forum/the-we ... 28397.html
https://gre.myprepclub.com/forum/wendy- ... tml#p91909
Show: ::
Attachment:
gRE set up an equation.jpg [ 198.71 KiB | Viewed 9874 times ]
Re: GRE Word Problems
[#permalink]
 10 May 2022, 00:28
Expert Reply
Consecutive Numbers
https://gre.myprepclub.com/forum/if-the-su ... tml#p92028
https://gre.myprepclub.com/forum/if-a-b-an ... tml#p92027
https://gre.myprepclub.com/forum/the-produ ... 28473.html
https://gre.myprepclub.com/forum/the-sum-o ... 28474.html
https://gre.myprepclub.com/forum/four-cons ... 28475.html
https://gre.myprepclub.com/forum/if-the-su ... tml#p92028
https://gre.myprepclub.com/forum/if-a-b-an ... tml#p92027
https://gre.myprepclub.com/forum/the-produ ... 28473.html
https://gre.myprepclub.com/forum/the-sum-o ... 28474.html
https://gre.myprepclub.com/forum/four-cons ... 28475.html
Re: GRE Word Problems
[#permalink]
 16 May 2022, 13:22
Expert Reply
Problems about Digit Numbers
https://gre.myprepclub.com/forum/if-s-a-tw ... tml#p92266
https://gre.myprepclub.com/forum/if-a-thre ... tml#p92249
https://gre.myprepclub.com/forum/a-two-dig ... tml#p92291
https://gre.myprepclub.com/forum/if-the-di ... tml#p92290
https://gre.myprepclub.com/forum/in-the-co ... tml#p92746

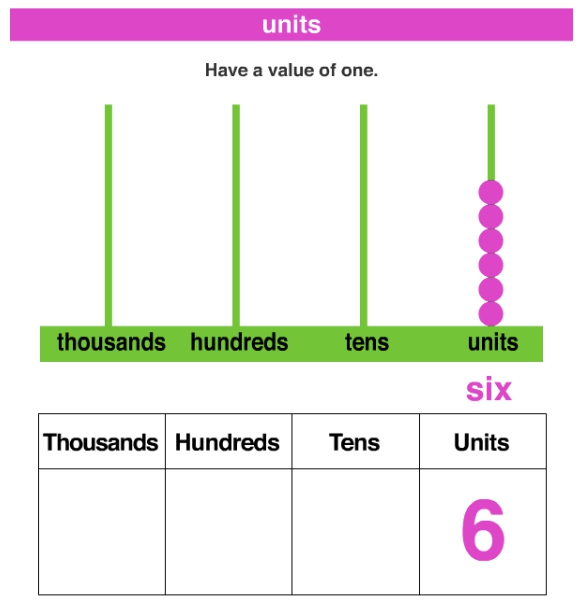
GRE unit.jpg [ 65.43 KiB | Viewed 9792 times ]
https://gre.myprepclub.com/forum/if-s-a-tw ... tml#p92266
https://gre.myprepclub.com/forum/if-a-thre ... tml#p92249
https://gre.myprepclub.com/forum/a-two-dig ... tml#p92291
https://gre.myprepclub.com/forum/if-the-di ... tml#p92290
https://gre.myprepclub.com/forum/in-the-co ... tml#p92746
Show: ::
Attachment:
GRE unit.jpg [ 65.43 KiB | Viewed 9792 times ]


